No matter what business news you read or watch, the topic of the day revolves around when the next recession will occur. While much of the discussion is around the timing and inevitability of the next recession, the equity and fixed income markets are still at or near all-time highs. So, it behooves us to share how we evaluate this question, what the data tells us and what issues we are closely monitoring
When economists and strategists ponder the potential causes of the next recession, there is a broad tendency to rely on signals that preceded prior recessions. This can be a helpful exercise so long as it is conducted with the view that no two recessions begin the same way. The Great Recession was a financial crisis caused by a housing bubble. Before that was the Dotcom bubble that popped when it became apparent that even Internetrelated business models need to be cash flow positive. Different causes but always the same result: asset prices decline, unemployment increases and consumer spending decreases until such time as some combination of monetary and fiscal policy comes to the rescue and confidence returns
We begin, therefore, with a comparative analysis of today’s economic conditions versus those just before the Great Recession. To that end, we have chosen to focus on 3Q 2007 as the period of comparison.
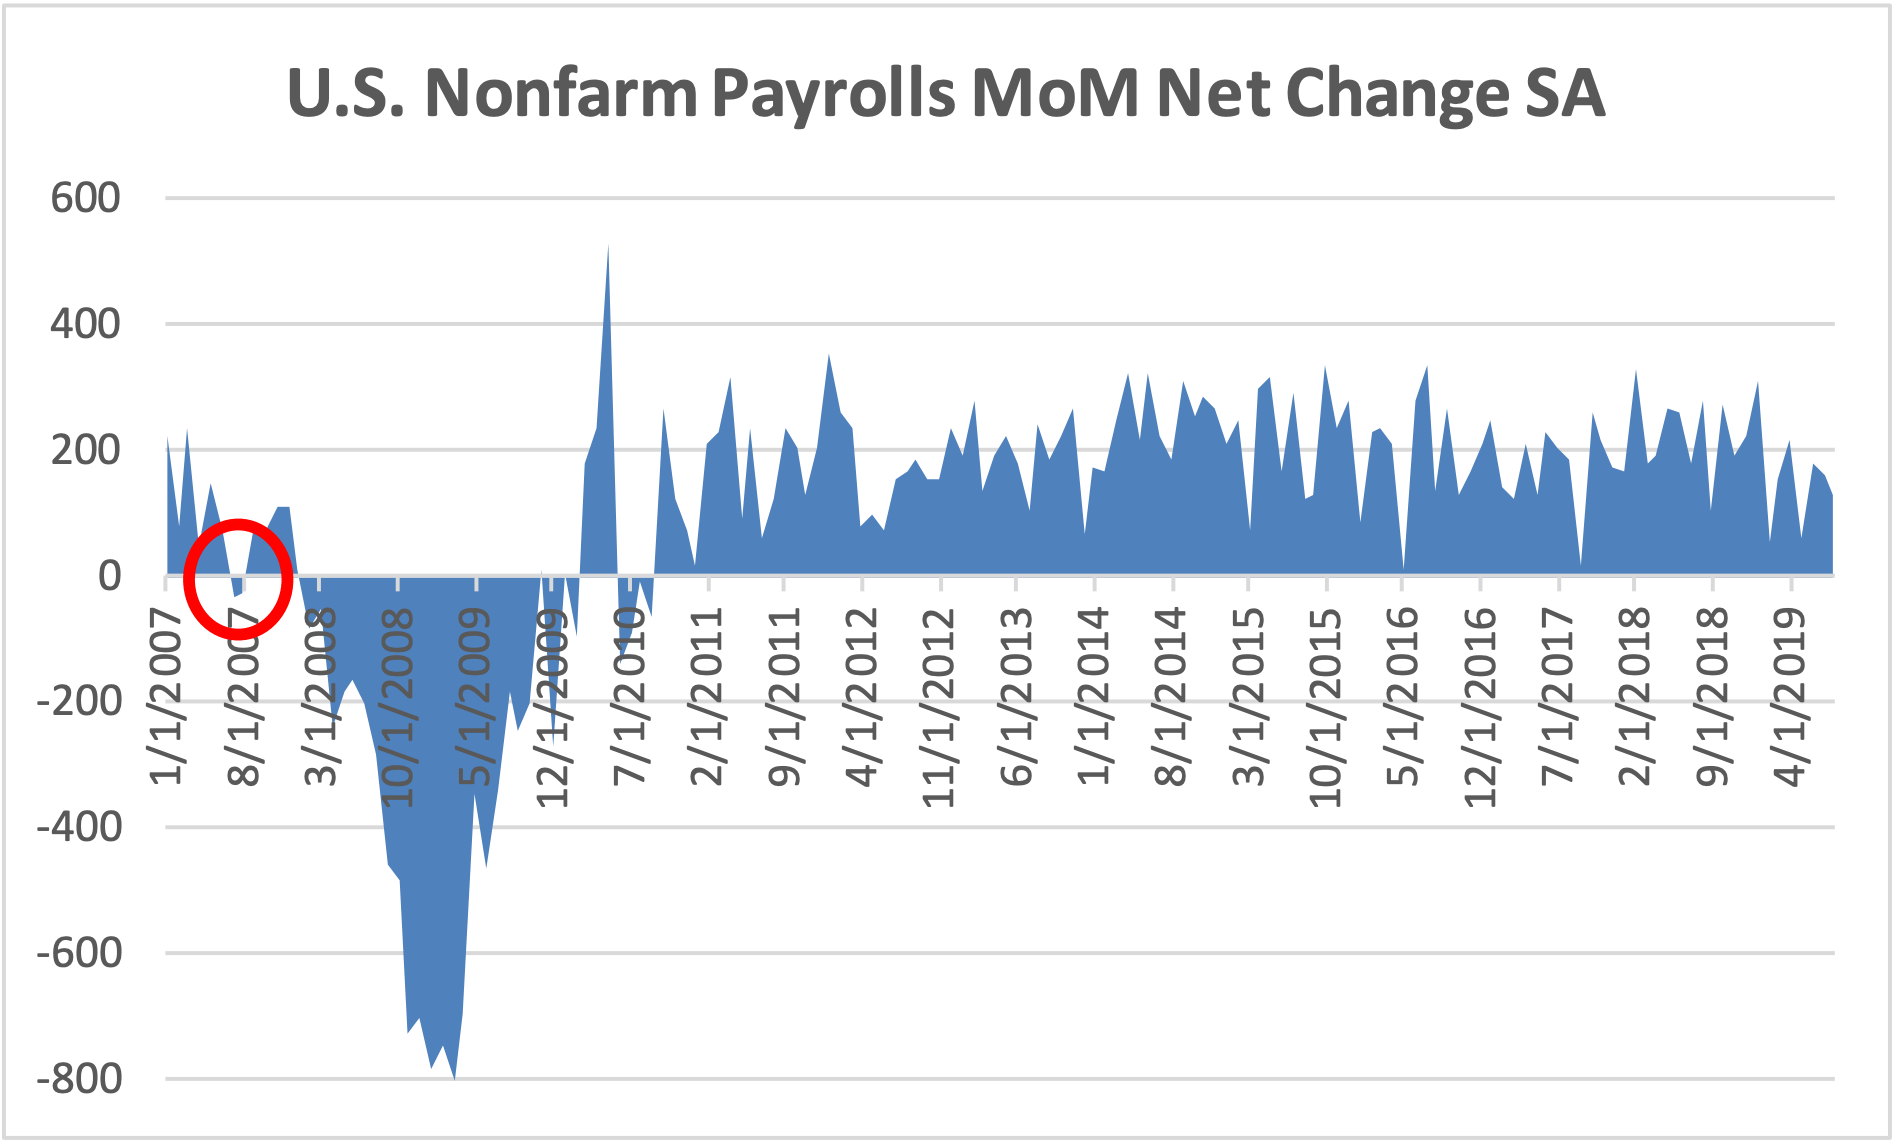
Source: Department of Labor, Bureau of Labor Statistics.
Why 3Q 2007? July 2007, specifically, was the first time Non-Farm Payrolls reflected sequentially negative growth on a seasonally adjusted basis. In short, this was the beginning of the end and was the single best indicator (that we can find) that predicted one of the worst asset market routs of all time and the Great Recession itself.
Comparing Today to 3Q 2007
Using the Financial System Vulnerabilities Monitor collected and published by the U.S. Treasury, we can compare the numerical scores of 58 key indicators of financial stability. As mentioned above, it is critical to avoid the natural desire to think that the next recession is going to look like any prior recession. Economies change over time. Monetary policy tools have evolved. Excesses are built up over economic expansions differently. Etcetera.
The Good
So, let’s look at where things are much better today than in 3Q 2007
The Financial System
The implementation of reforms, most notably Basel III and Dodd-Frank, clearly achieved their purpose as far as dramatically reducing leverage on bank balance sheets and shoring up capital. Thus, the banking system is much more solvent and funding risk is significantly lower. Furthermore, the interdependency among banks is much lower, which reduces the likelihood of contagion risk and asset fire sales.
Although, one area that screens dramatically worse today is the ratio of commercial loans to deposits, which can increase liquidity risk. However, do not be fooled. This increase is not due from excessive lending but rather from a regulatory-driven requirement to hold more capital in the form of subordinated debt (or Tier 2 debt) and equity instead of deposits.
All in all, these relative data points suggest that the next recession does not take the form of a banking crisis and complete meltdown of asset markets.
The Housing System
Similarly, mortgage regulations implemented since the Great Recession has dramatically lowered the amount of mortgage debt relative to household income and GDP growth. Hence, mortgage debt service ratios are much lower than 3Q 2007. So, this suggests that the next recession does not include a housing crisis.
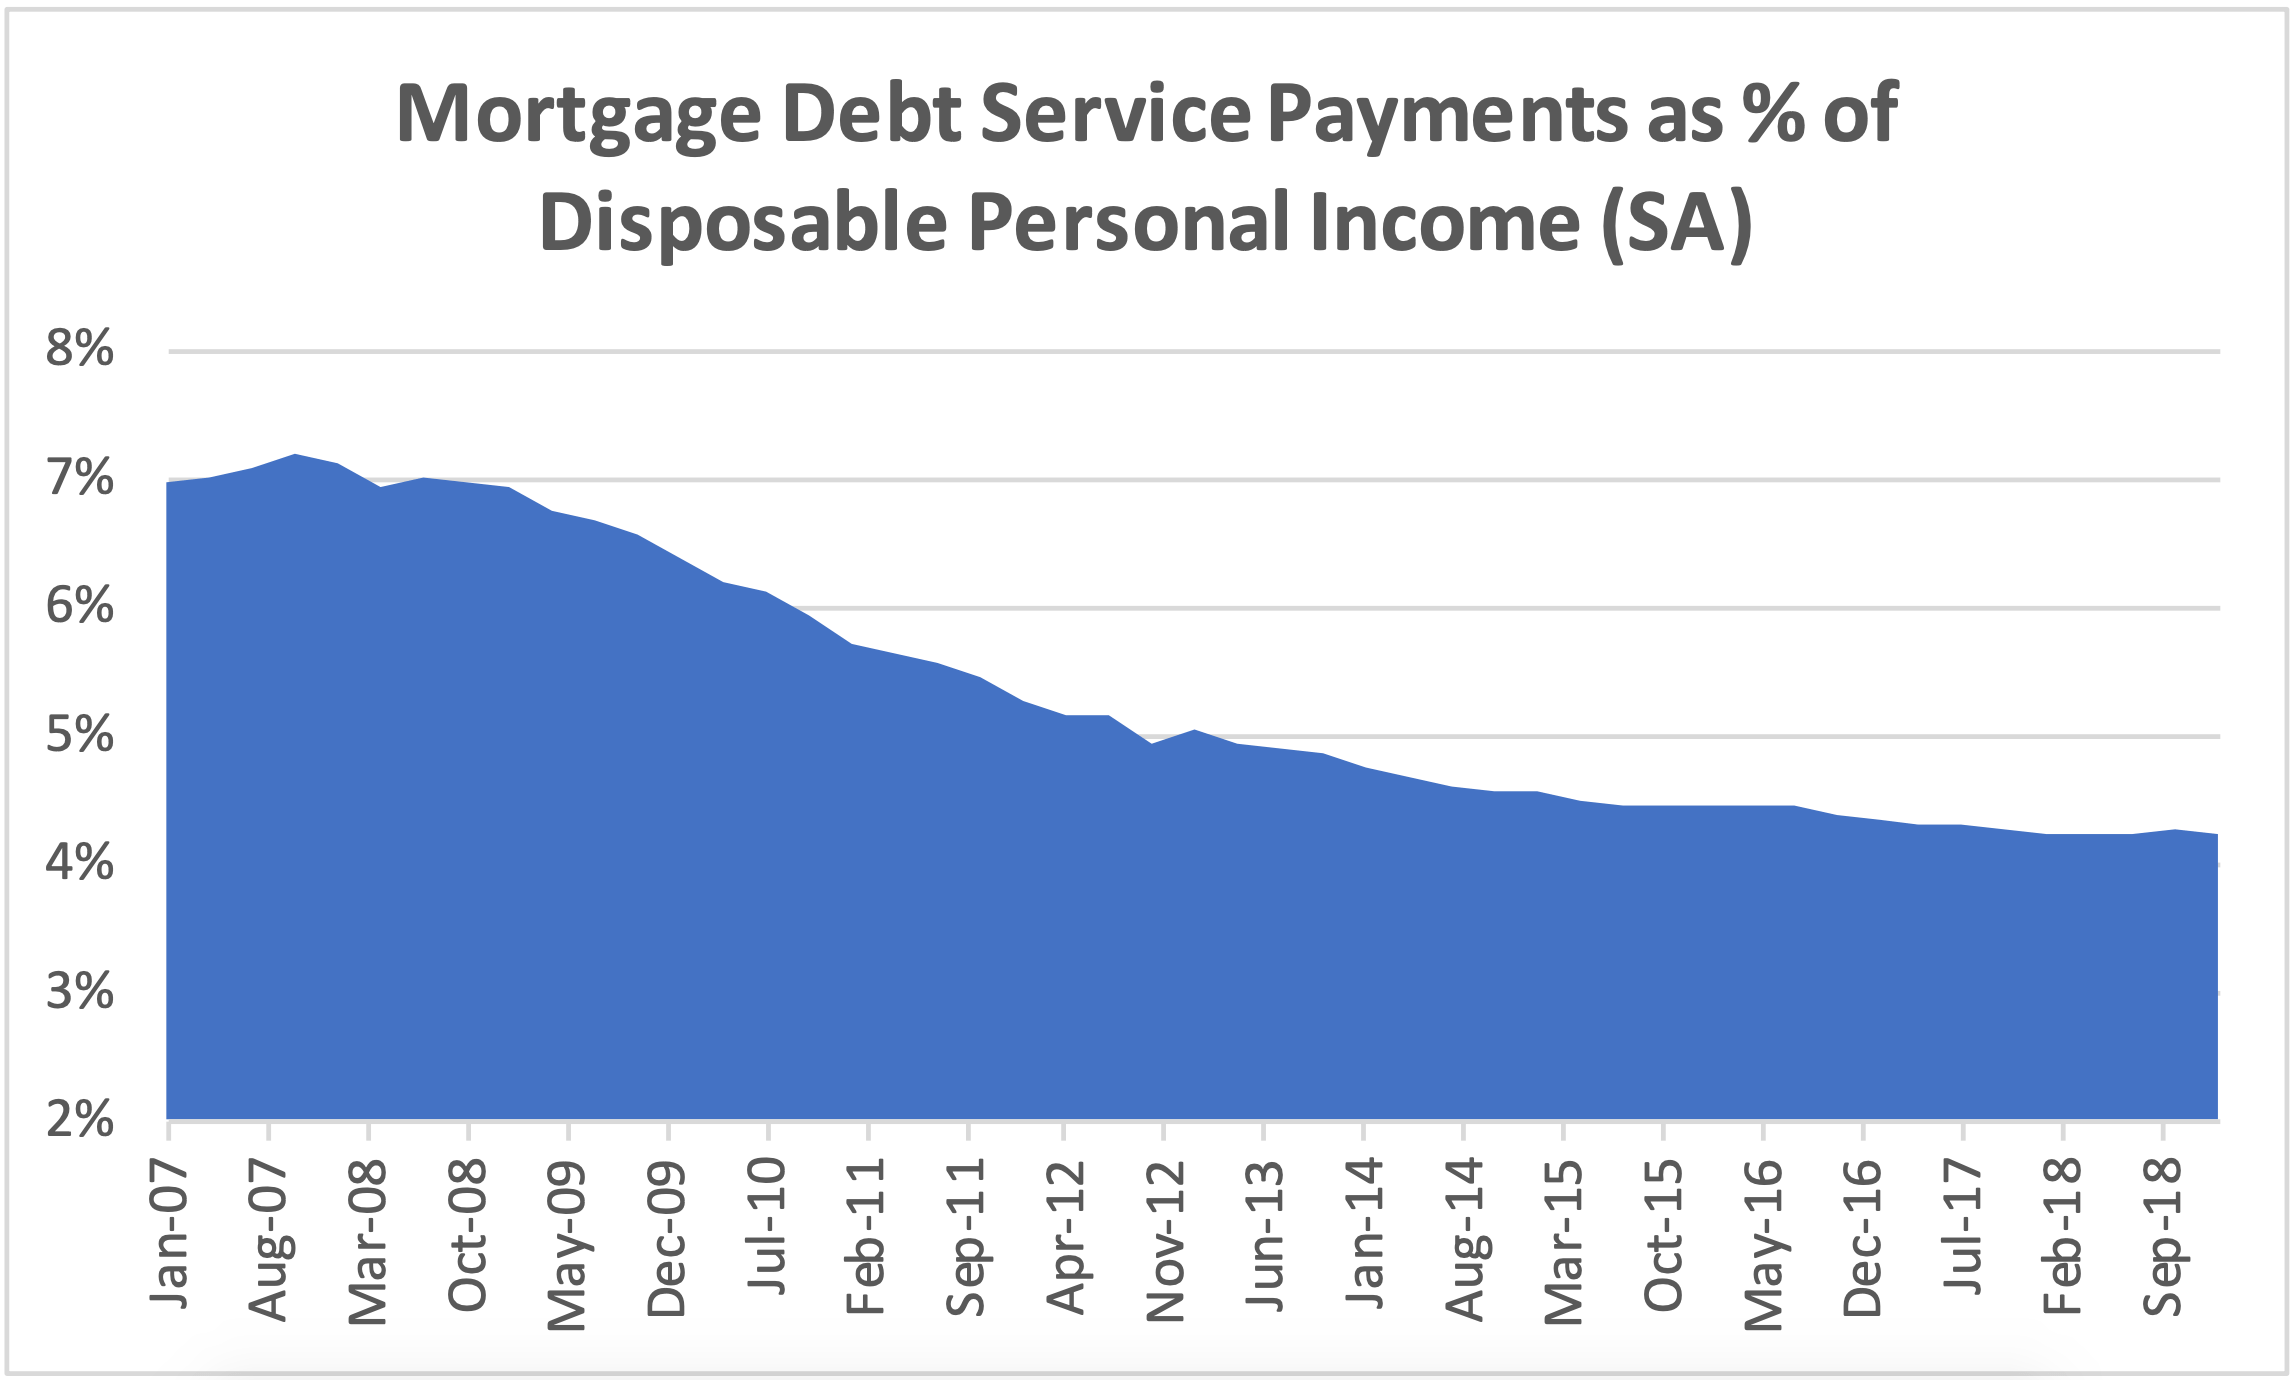
Source: FRED St. Louis Fed
The Bad
There are several data points that are as bad today as they were in 3Q 2007.
Market Risk
Valuations of equities, Treasuries, mortgage-backed securities, corporate bonds are all at or slightly above where they were in 3Q 2007 before the market’s historic decline. That is not comforting and raises the obvious question of “where should I invest?” Perhaps even more surprising is that house prices/income and the home price/rent ratio are nearly as high as they were in 3Q 2007. The surprising aspect of these data points is how little mention there is of a housing bubble. With significantly higher mortgage underwriting standards today versus 2007 and the years leading up, much of this increase is likely fueled by the enormous wealth that has been created by the stock market and low mortgage rates have kept servicing costs lower than normal.
Household Credit Risk
By now, many of us have heard about the incurrence of vast amounts of student loans, auto loans and credit card balances by U.S. consumers. Outstanding balances have more than doubled since 2007, however, incomes have grown significantly as well. Nevertheless, the consumer debt/income and the consumer debt/service ratios have risen to a level now commensurate with 2007 pre-crisis levels, which is reason for some concern. As we ponder the consequences of tariffs, particularly those set to hit on December 15th, we are concerned that they could create a tipping point.
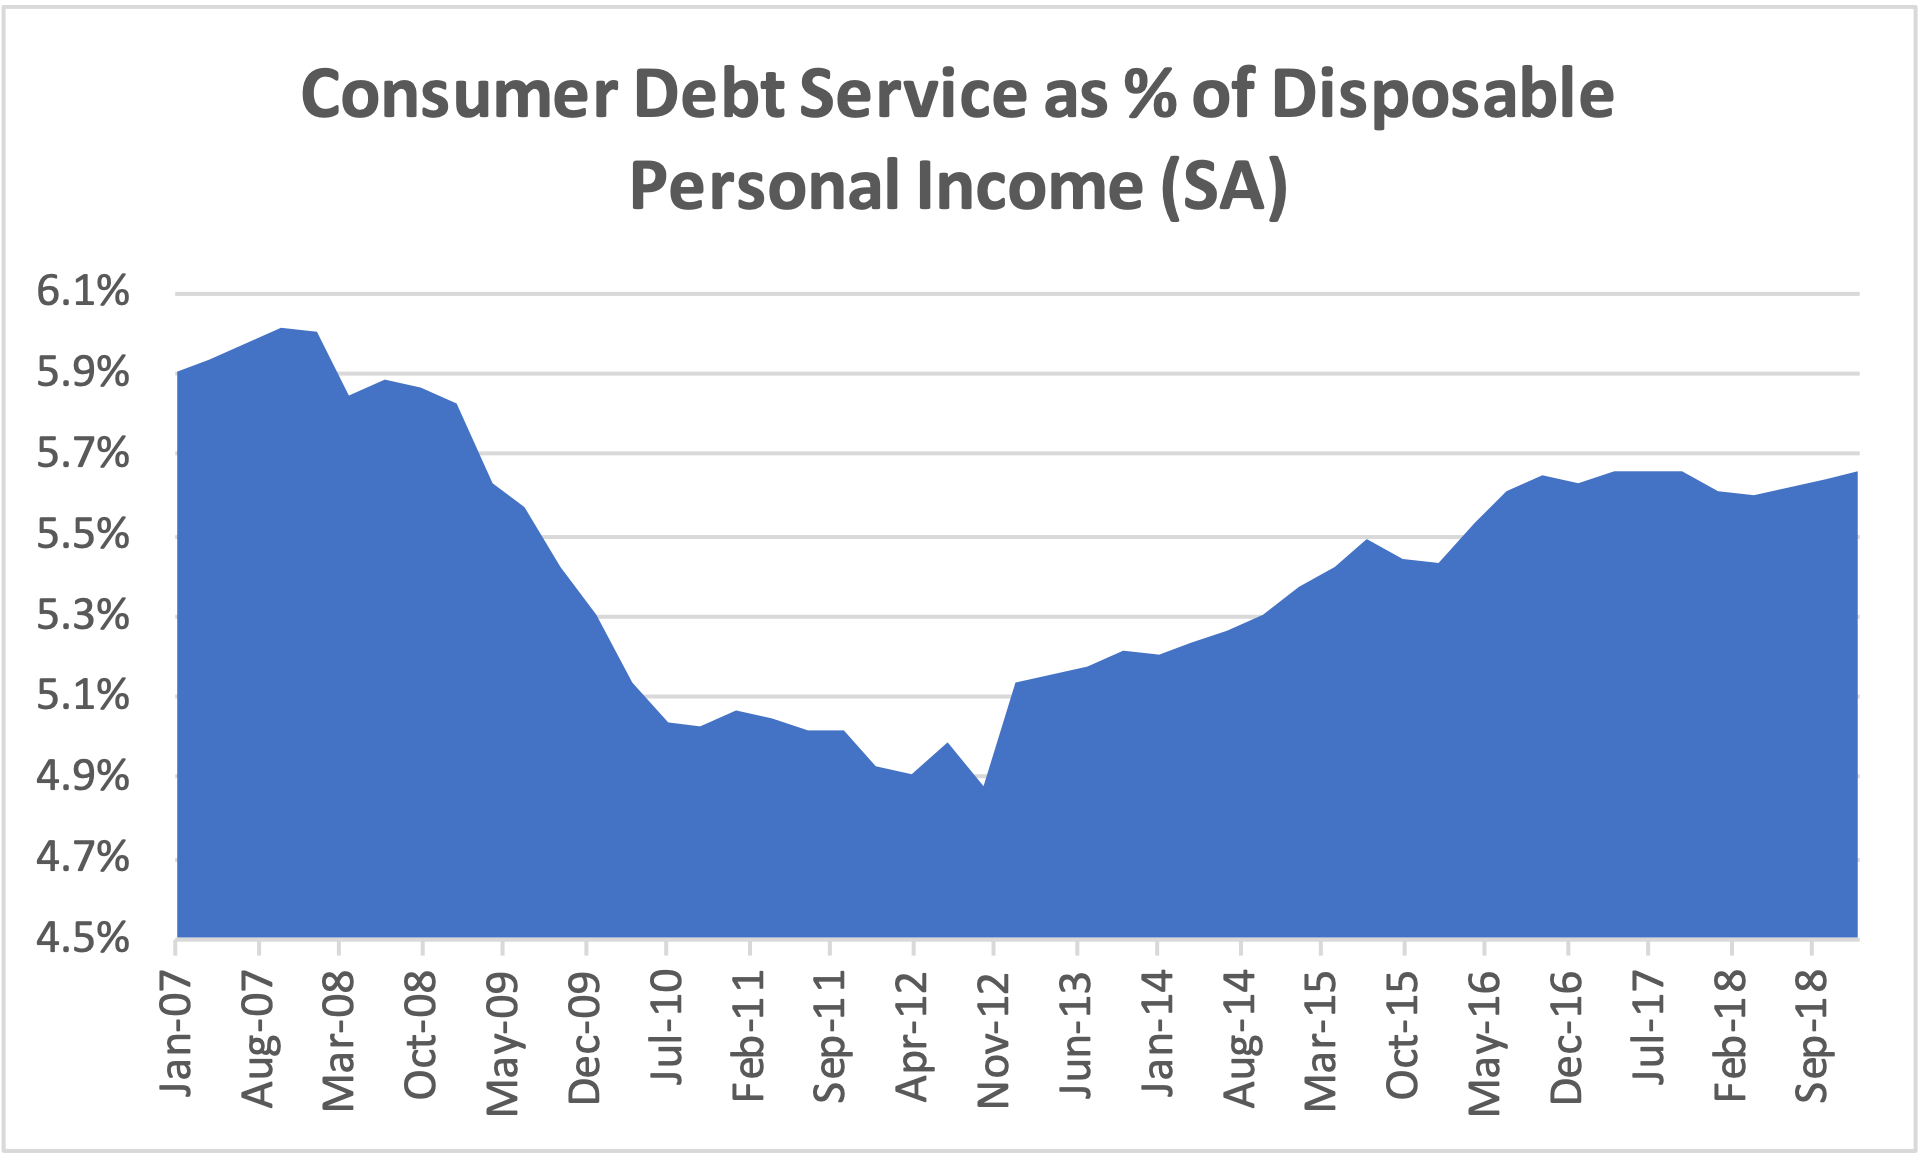
Source: FRED St. Louis Fed
As we mentioned above, the most critical factor to watch is when Non-Farm payrolls start posting negative month-over-month changes (seasonally adjusted). During the Great Recession and the decade that has followed, I met many times with the management teams of the major credit card companies. The Great Recession took them all by surprise, so much of the discussions centered on risk management and how delinquencies and defaults increased so much and so rapidly. In the end, the answer was quite simple: the change in non-farm payrolls. Significant indebtedness and a lack of savings meant that any loss of employment and delay in getting a new job tipped the scales just enough to drive massive consumer distress. The fact that we have similar levels of consumer indebtedness and all-time low unemployment makes the stakes high today.
To put a finer point on the fragility of consumer credit, according to the Institute for International Finance, the bottom 50% of Americans have negative net personal wealth. Definitionally, this means that roughly half of Americans are living paycheck to paycheck. The Federal Reserve Board’s report entitled the “Economic WellBeing of U.S. Households”, found that 40% of adults could not cover an unexpected $400 expense without selling something or borrowing money. In short, many Americans have little if any ability to endure unemployment for any material period, which paints an ominous picture for consumer credit during the next recession.
Margin Loans at Brokers and Dealers
One metric not captured by the Treasury’s Financial System Vulnerabilities Monitor is the total amount of margin loans held by consumers at broker-dealers. Margin loans were arguably among the earliest part of the lending world to return to pre-crisis levels. At roughly $300 billion, these margins loans are subject to customary collateral requirements that if the equity market were to decline significantly could be called, which would further exacerbate any market decline.
The Ugly
There are some financial stability indicators that are significantly worse today than in 3Q 2007.
Fiscal Irresponsibility
Deficit spending by the Federal Government during the last twelve years has led to an unprecedented level of National Debt/GDP. In fact, excessive Federal Government spending has increased the National Debt from 62% of GDP in 3Q 2007 to 105% today. While there seems to be insatiable demand for Treasuries today, this could change and, if so, that could hinder the ability of the Federal Government to inject the economy with fiscal stimulus when needed.
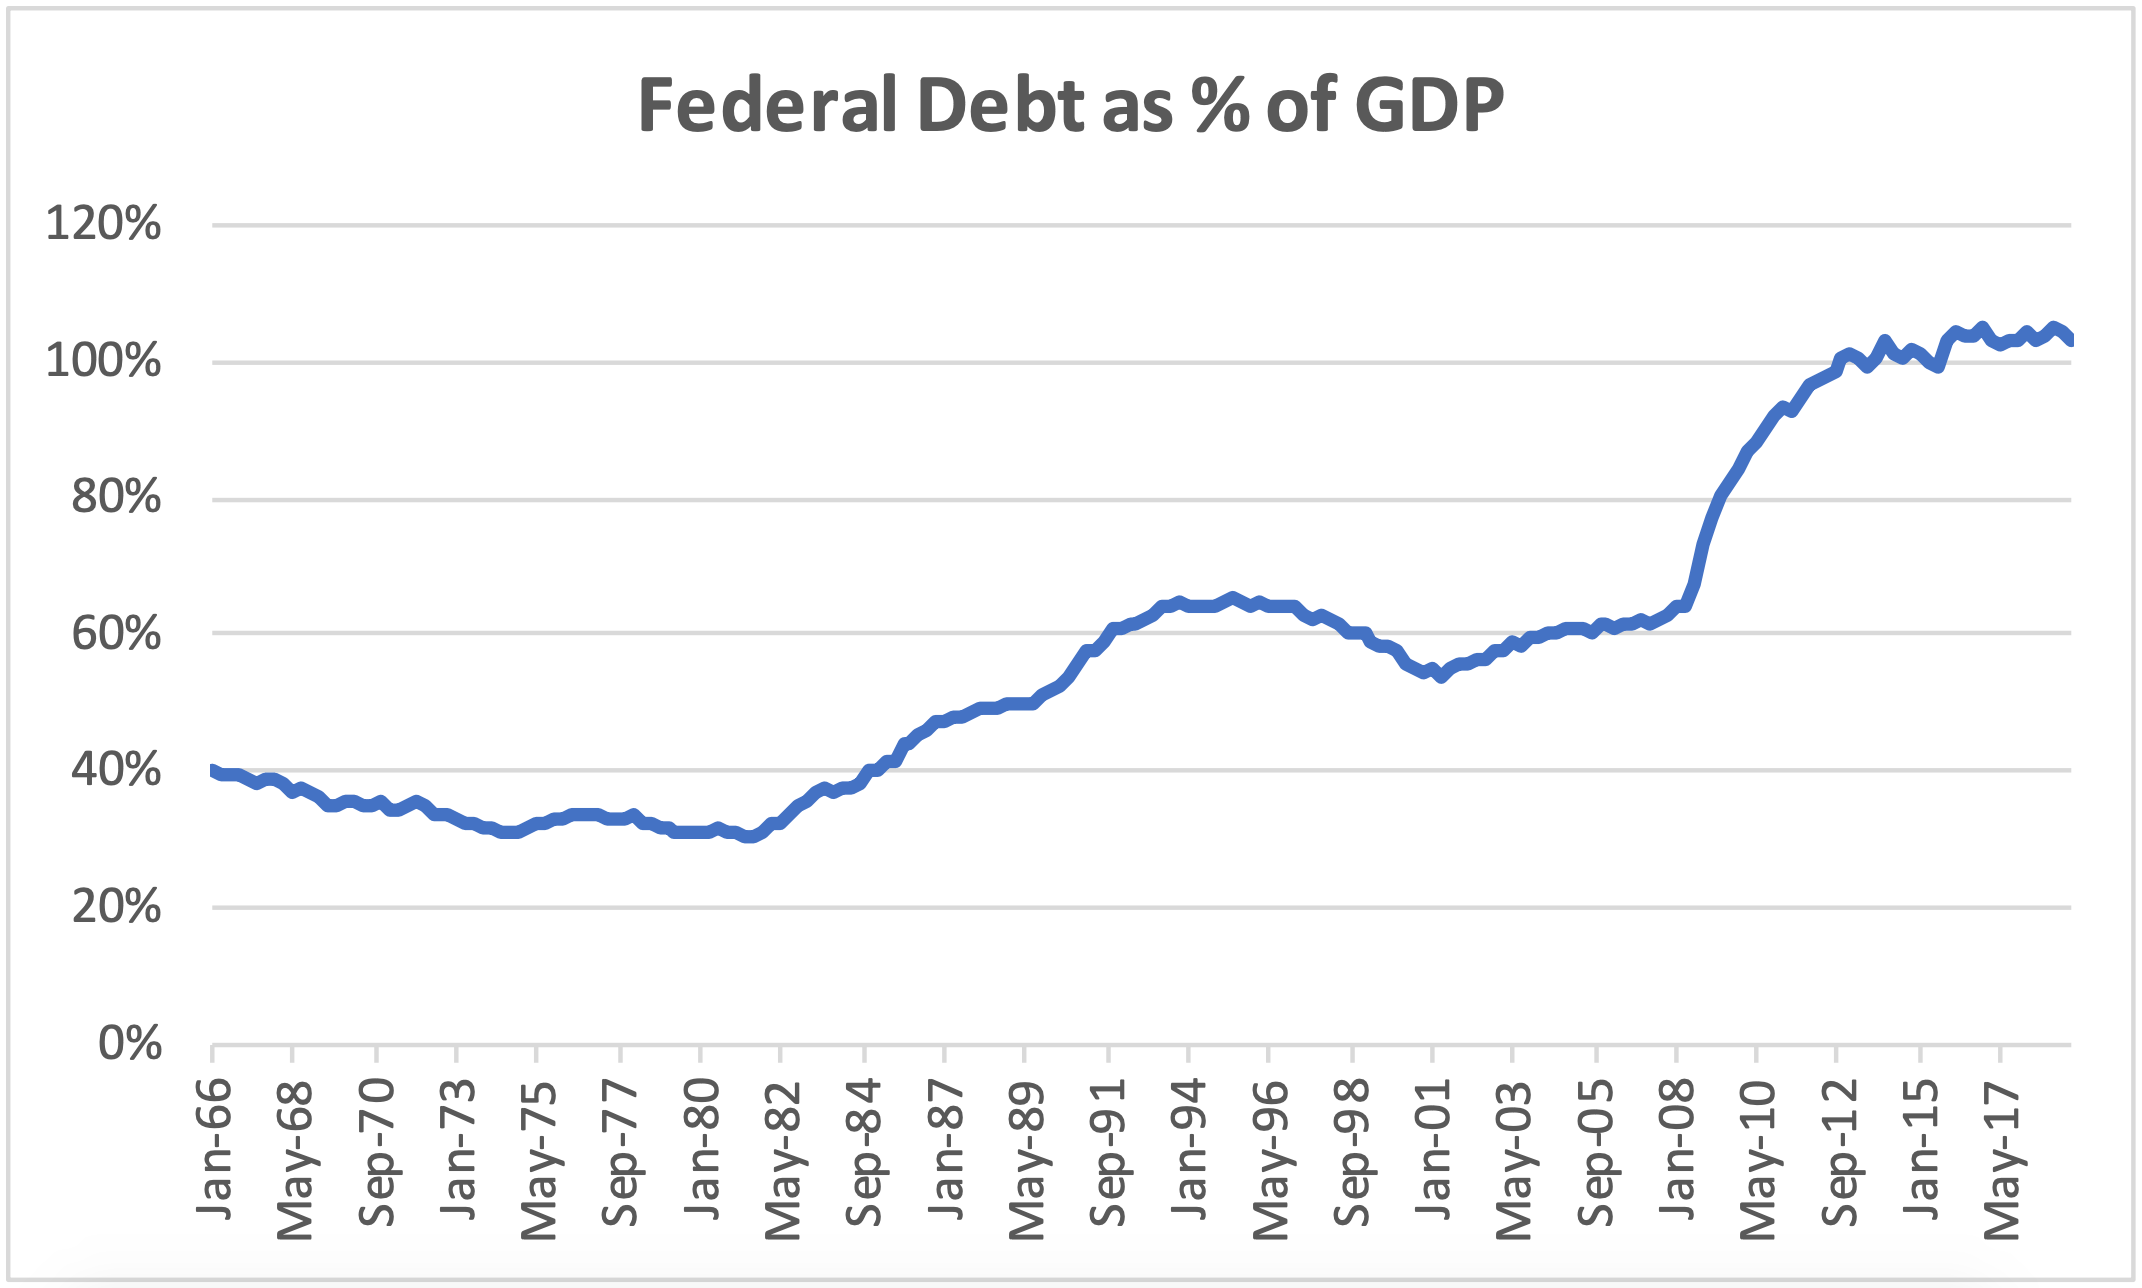
Source: FRED St. Louis Fed
Corporate Indebtedness
Corporate indebtedness is much higher today than in 3Q 2007. According to the Federal Reserve, nonfinancial corporate indebtedness reached $6.4 trillion in 1Q 2019, which is nearly double the $3.3 trillion held in 3Q 2007. If one adds in other liabilities, such as trade, tax and pension liabilities, the percentage of corporate debt to GDP increase to 98% - an all-time high. Leveraged loan issuance has been a significant driver of this growth, accounting for $1 trillion of the increase.
The huge growth in leveraged loans was principally driven by Collateralized Loan Obligation (“CLO”) funds, which buy leveraged loans and then securitize them for re-sale to yield hungry investors, like banks, insurance companies and pension funds. CLOs packaged up approximately $600 billion of leveraged loansin recent years. The rise of CLO funds since the Great Recession served to skirt Basel III capital requirements to enable banks to own leveraged loans in security form rather than hold them as loans on their balance sheets. Growth was also supported in 2017 and 2018 as the Fed raised the underlying base rate and as loans are traditionally priced as a spread to the base rate (usually Libor or Prime), loan investors therefore structurally participated in higher rates. Today, with the Fed now lowering rates, the allure of leveraged loans has faded. Year-to-date, investors have withdrawn $26.3 billion from leveraged loan funds, according to Lipper.
Complicating this situation are two issues to watch closely because these could create a major price dislocation if triggered. Firstly, CLOs and individual leveraged loans are illiquid instruments. In Wall Street parlance, they trade “on appointment”. The inefficiency trading these instruments is poor even in robust markets, so selling in a down market is difficult if not impossible. This situation would be exacerbated today versus 2008 due to the implementation of the Volcker Rule, which now prevents traditional suppliers of liquidity (i.e., investment banks) from effectively making markets. Secondly, many of these leveraged loans were issued “covenant-lite”, which means that the usual contractual requirements put in place to provide protection against nonrepayment were significantly diluted or eliminated entirely. When markets fall, investors desire more default protection. Consequently, leveraged loan prices could disproportionately decline due to lack of interest. For these reasons, we are leery of leveraged loans today.
Bond Durations Are Dangerously Long
I know bond durations is not exactly the most exciting topic. Before you stop reading, you must understand how incredibly important this issue is today. If you take nothing away from this research report, remember this: Corporate bonds are no longer a safe haven. Corporate bond investors can and may very well lose money.
The traditional investment manager or financial advisor has long abided by the notion that bonds are safe and stocks are risky. That is no longer the case. Bonds are risky today. What is driving this change is called duration. When bond yields decline to the extremely low levels of today, bond durations lengthen. Mathematically, bond price and, hence, yield representsthe present value of the expected cash flowsthe bond investor expects to receive. When yields are low, the bond investor is essentially getting most the value of owning the bonds on the day of maturity. Intuitively, the bond investor is taking more risk because the longer you wait the more bad things can happen to that bond issuer or rates thereby jeopardizing repayment. Duration in plain English determines how volatile a bond’s price is for every 1% move in interest rates.
Here’s a real-world example:
IBM is a very stable, investment grade company, as we all know. They recently issued a bond with a 4.25% coupon that matures in 2049. That bond’s price at the time of writing is 116.1. The bond’s duration is 17.6 (historically very high). A 1% increase in rates would cause the bond’s price to fall 16% to 97.8! This is equitylike risk.
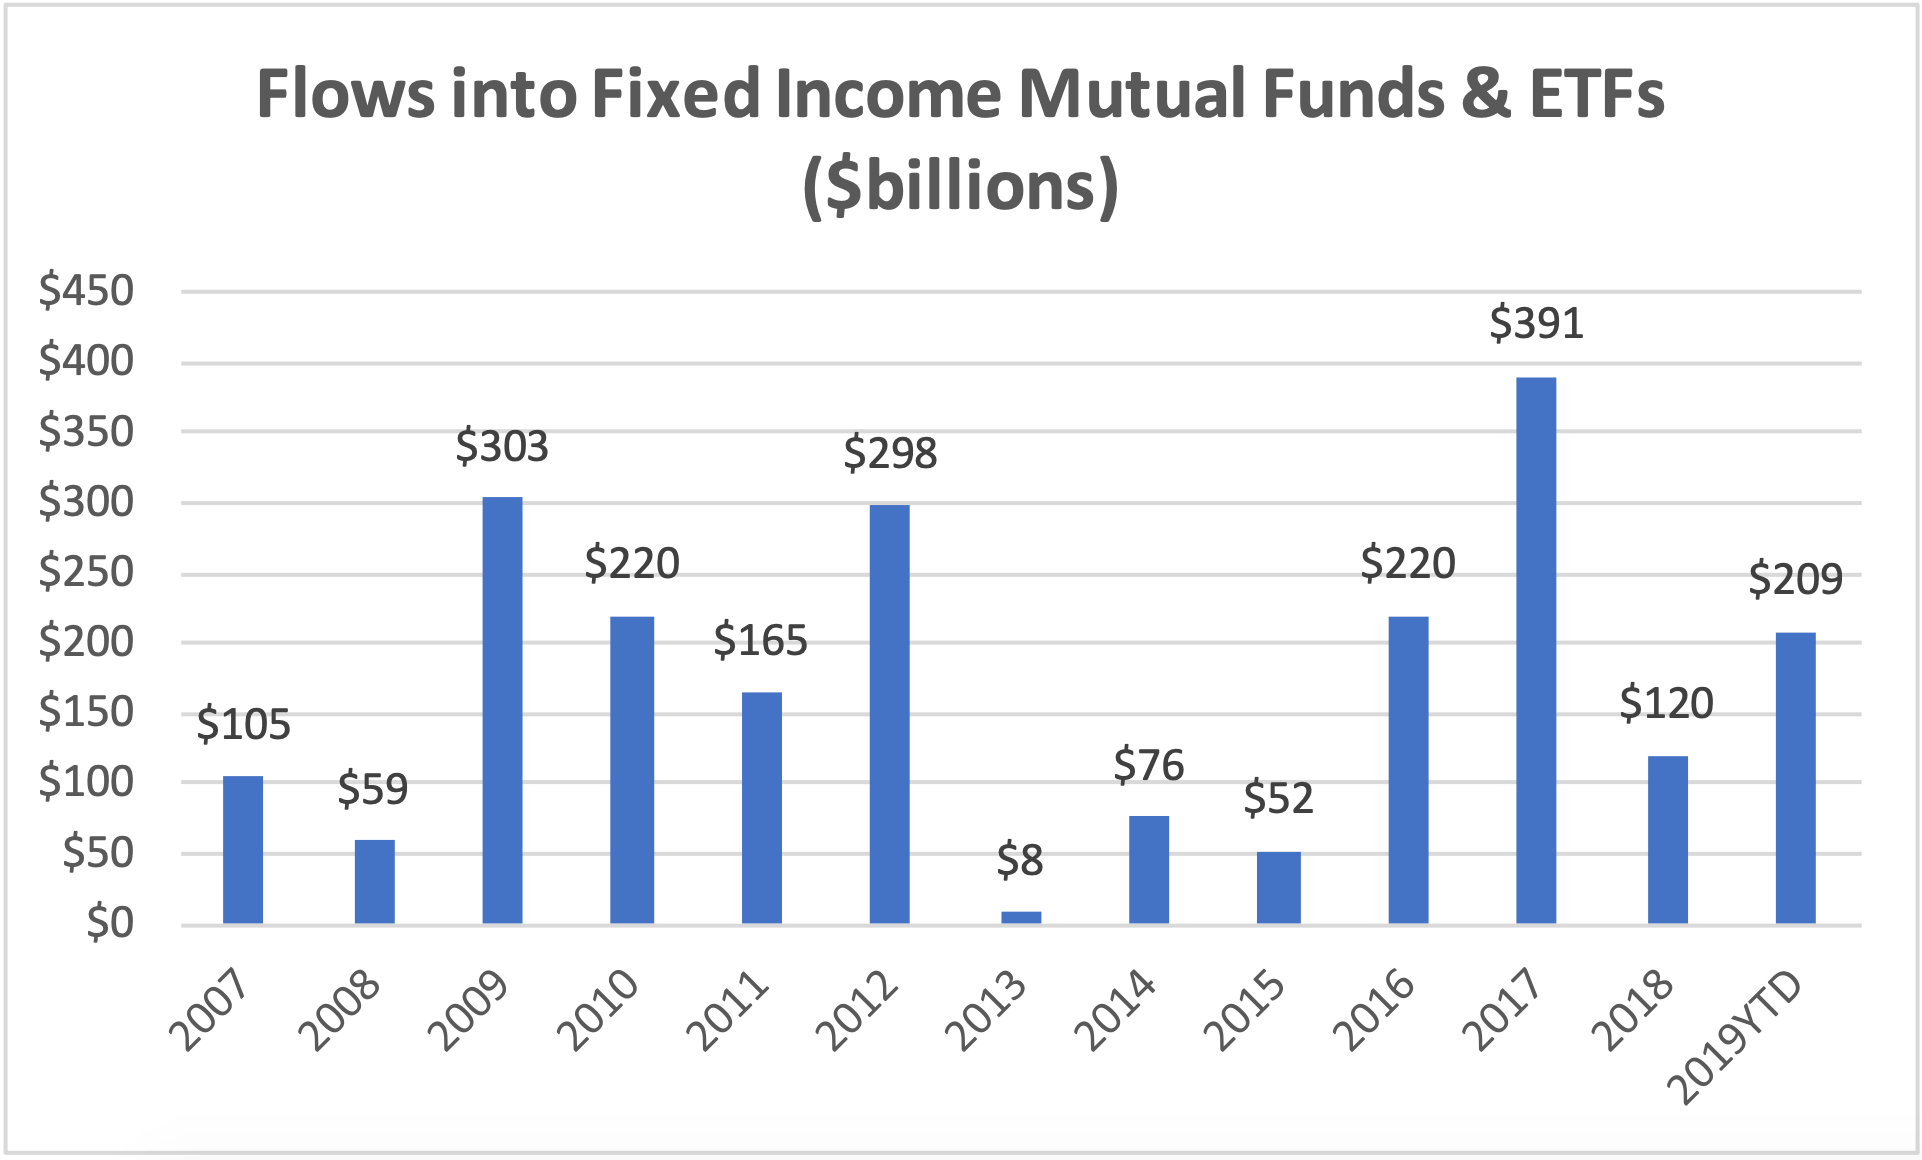
Source: Investment Company Institute.
Why this is a cause for concern is that this year $209 billion of investor money has flowed into corporate bond ETFs and mutual funds. This in turn has fueled a huge wave of corporate bond new issuance. These investors are at enormous risk of loss if rates move even a little bit higher. As such, we are super cautious on having too much exposure to duration today.
“Corporate bonds are no longer a safe have. Corporate bond investors may very well lose money.”
The Key to the Timing of the Next Recession is Payrolls
The key risk to the markets and the signal we are most keenly focused is U.S. Non-Farm Payrolls. Why? Because 70% of GDP is based on Personal Consumption, according to the Bureau of Economic Analysis, employment is critical to funding this spending. Further, as we noted above, a good deal of this spending on done on credit, so having a job to service the associated credit card or auto loan, for instance, is crucial to economic growth.
As it is imperative to understand employment trends, we look to several leading indicators to inform us on the possible direction of this important piece of data.
Temporary Staffing
Temporary staffing payrolls are often viewed as a “canary in the coal mine” because often companies will hire temporary workers who then transition into full-time employees. This industry provides many workers with a pathway to full employment and thus indicates the hiring intentions of their various business clients. In July, the BLS reported 3.0 million temporary workers – essentially unchanged since January and near its cyclical high thus far. To us, this is a bit of a mixed message. While a very solid number, we have not seen much growth during the last year. Nevertheless, at current levels, the economy should continue to add workers.
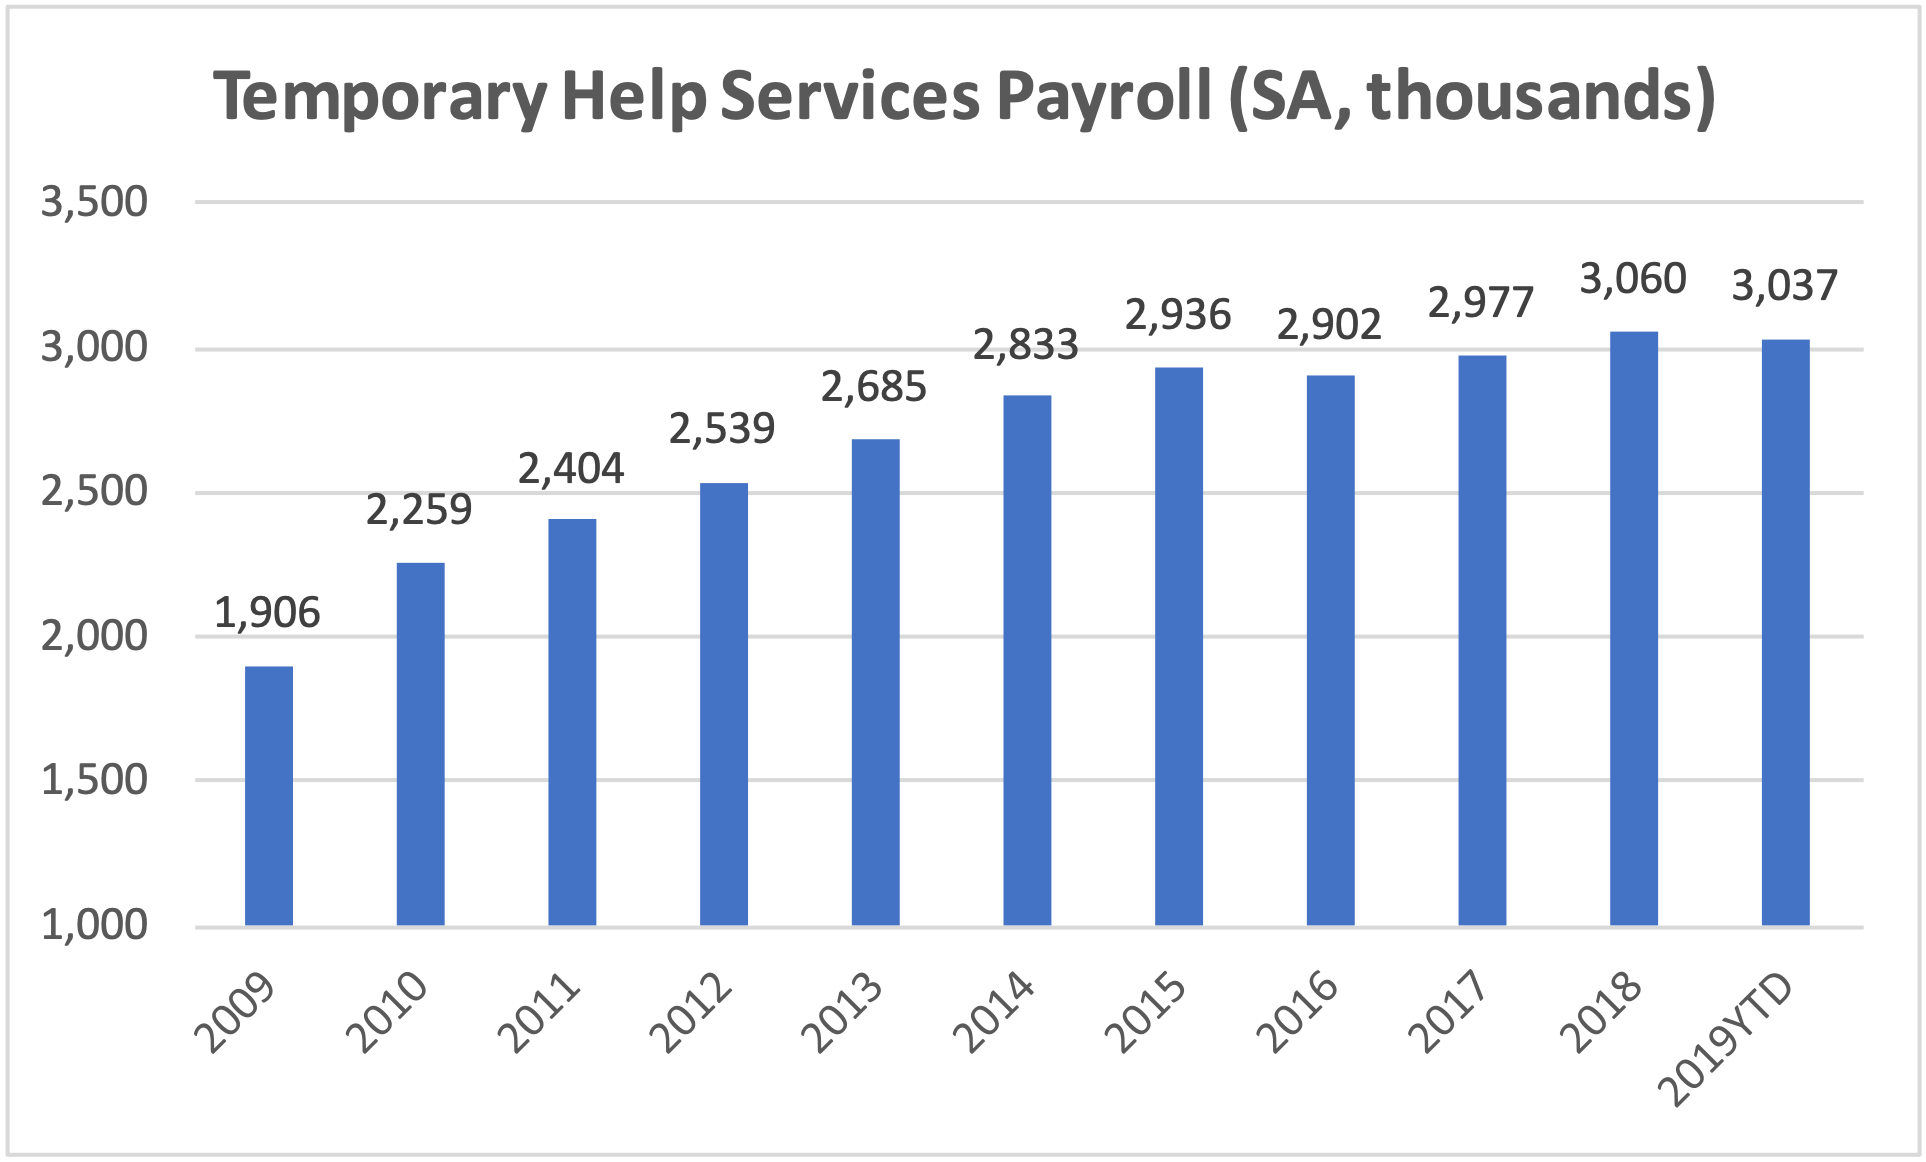
Source: Department of Labor, Bureau of Labor Statistics.
Initial Jobless Claims
This data point has long been viewed by economists as an important leading indicator and while it suffers from volatility created by seasonal layoffs at manufacturing plants, it generally does a good job of alerting us to potential changes in payrolls. Initial Jobless Claims have consistently declined each year since the middle of 2009. Where this datapoint bottoms out is anybody’s guess, but we are probably close as recent prints in the low 200,000 per week are at the lowest levels since 1969!
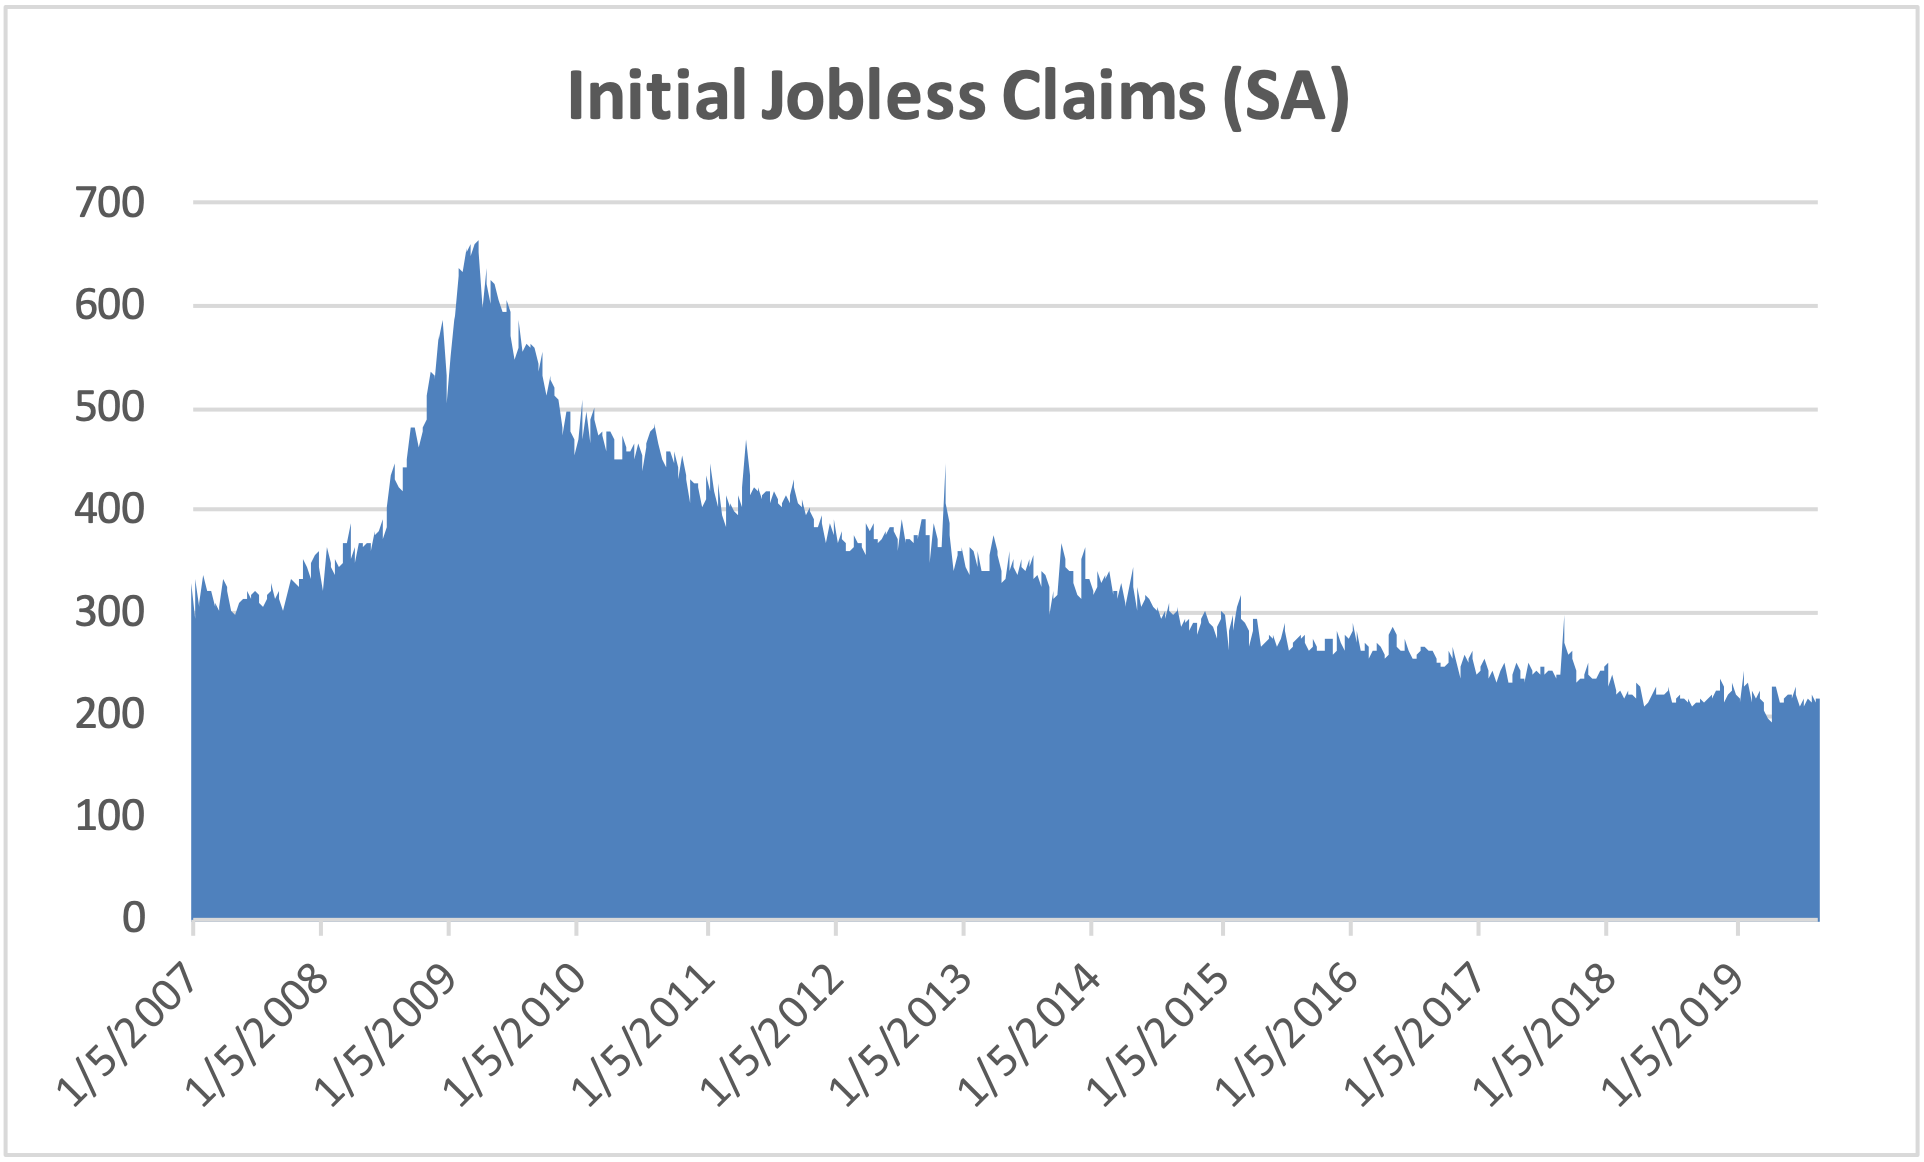
Source: Department of Labor.
Beware of False Red Flags
The most common mistake investors make in forecasting recession and associated market tops is utilizing datapoints that may have been useful in predicting past recessions but are no longer as relevant. The reasons behind economic data points becoming less relevant are typically driven by the evolution of the U.S. economy. We look at several factors below that historically were great leading indicators that no longer hold the same predictive power as before.
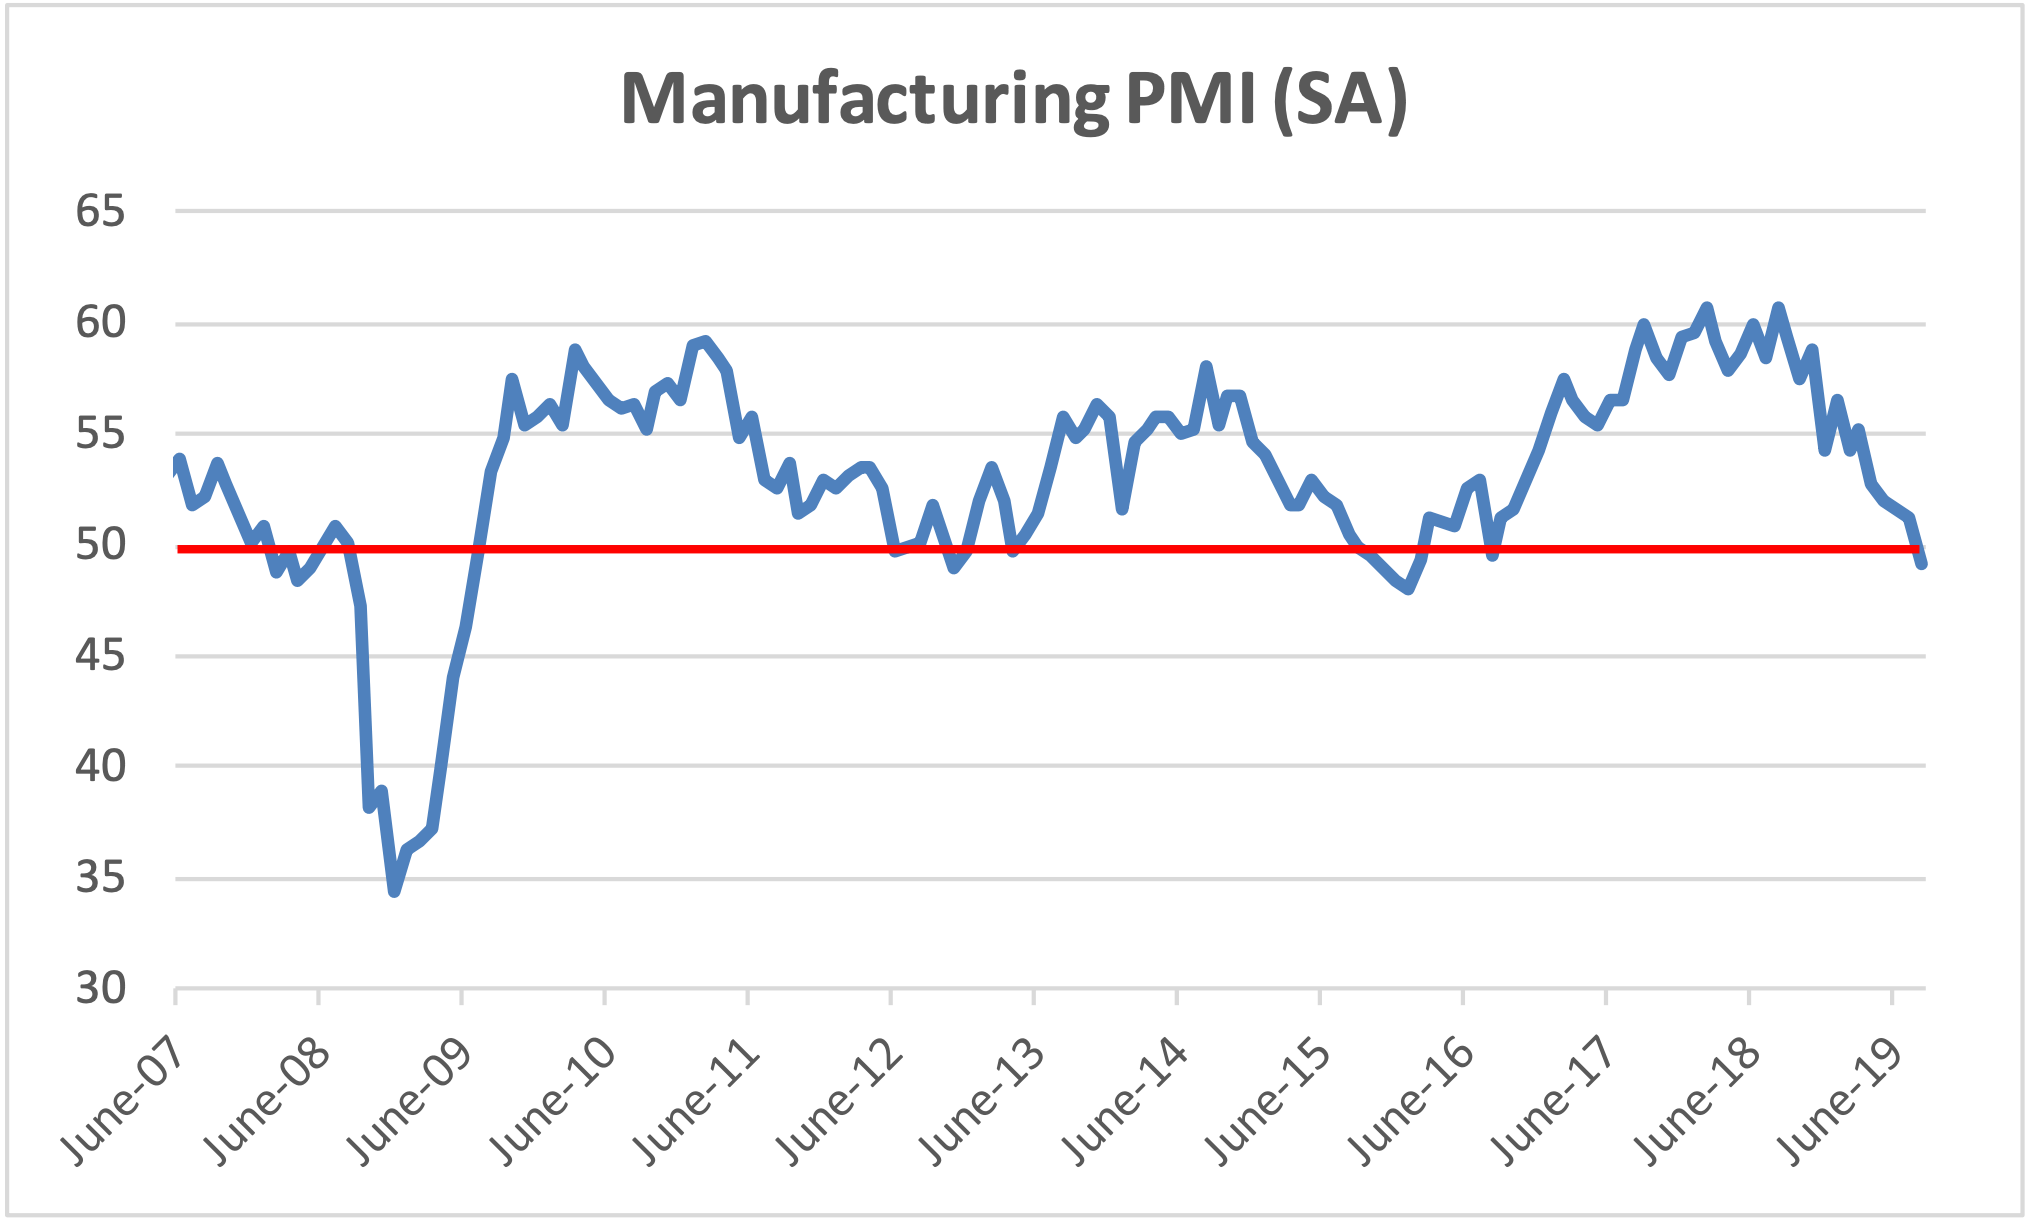
Manufacturing Payrolls/ISM Survey
It should not be any surprise to any market observer that the Manufacturing sector has become less and less of a driver of the U.S. economy. Nevertheless, cries can still be heard throughout the investing world over recent weakness in the Institute of Supply Management’s monthly survey of manufacturing conditions. As a diffusion index, any reading below 50 means that the manufacturing sector is contracting and, conversely, a reading above 50 means that the sector is expanding.
Unfortunately, the manufacturing sector is rather irrelevant to the overall U.S. economy. We just don’t make much here anymore. The best way to observe this effect is in the payroll survey published monthly by the Bureau of Labor Statistics. Today, total Manufacturing employment is just 12.9 million workers. That equates to only 8.5% of the total working population of 151 million. Manufacturing payrolls are down 26% during the last twenty years. In other words, Manufacturing has been a drag on the economy through the last two economic cycles. It’s just not that relevant anymore. In fact, there are now more workers in Leisure & Hospitality now than Manufacturing. So, perhaps our time is better spent focusing on Hotel RevPars and Airline seat utilization. There are also materially more workers (24.3 million) in the Education and Health Services industry.
What is really going on here is that as the economy has shifted to more services and away from cyclical, capital intensive industries, like manufacturing, it has become definitionally more defensive. In other words, as manufacturing has moved offshore, those countries now bear the cyclical risks associated with changes in consumption. Variances in production are now increasingly absorbed by foreign workers.
Source: Institute for Supply Management.
Inverted Yield Curve
Traditionally, an inverted yield curve has been a solid predictor of recessions, but we do not think that is necessarily true today for two reasons. First, in previous recessions the data suggests that the Fed was simply late to cut short term rates. So, while the bond market reacted, the Fed stood by essentially oblivious to the deteriorating conditions around them. Hence, the curve inverted. Second, the long end of the U.S. Treasury curve is a very attractive investment relative to other global alternatives. No major developed country in the world has a yield on their long bond higher than the U.S. Even Greece trades inline with the U.S.! So, when a bankrupt country that cannot even print its own currency is as good a credit asthe U.S., the relative value trade becomes abundantly apparent. That’s why we were buyers (hand over fist) of the US 10Yr Treasury during the last year.
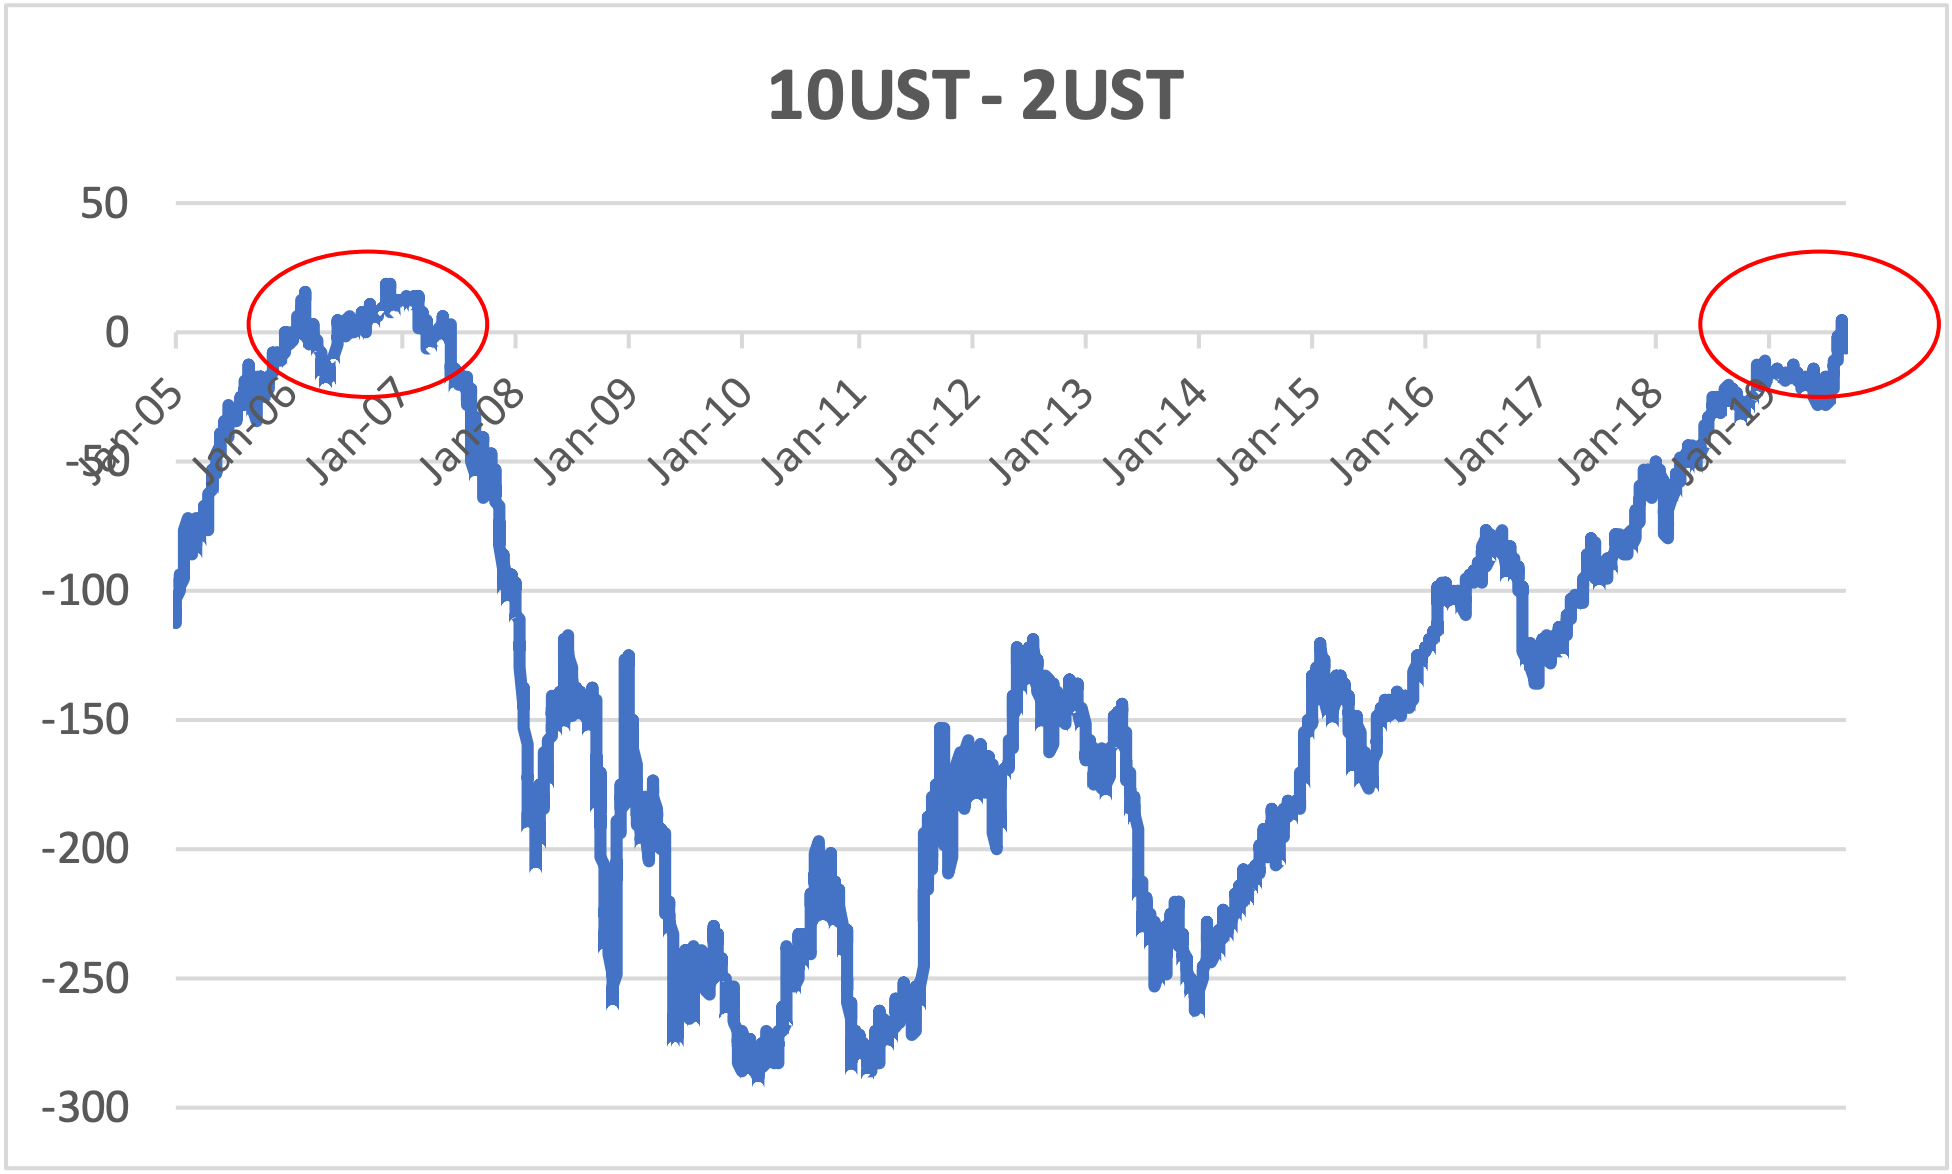
Source: Bloomberg.
What do these two factors have to do with the underlying health of the U.S. economy? Very little. The U.S. economy is structurally superior to all other above noted economies. There is more innovation, more flexible movement in labor, fewer regulatory hurdles, a stable government (yes, that is true) and diversity of industries.
Level Setting
The U.S. economy is in a globally unique position. Picture the “Hunger Games” movies where there is a rich, robust capital district that sits atop a dozen other districts that specialize in various trades and toil in their fields, factories and mines for the benefit of the capital district. The U.S. is the capital district. It is the residence of most of the largest companies in the world. Countries outside our borders supply the lower value-added resources necessary to sustain and grow our lifestyles. And when a trade spat arises with one of these suppliers of labor (e.g. China), supply chains adapt and relocate to places more hospitable. During the last year, as we have listened to hundreds of conference calls with C-level executives, we continue to be amazed by the proactive and flexible strategies businesses are putting in place to adjust to the new global supply chain reality.
With that said, we are concerned about the planned escalation of the US-China trade dispute. We have sifted through every page of the four tariff lists and concluded that very little damage would occur from tariffs currently implemented. These lists include things like live animals and Scotch whiskey…why would we import Scotch from China?! In other words, a whole lot of imports that matter very little to you and me. That said, List 4B goods are the real deal. Fifteen percent tariffs are proposed go in effect on December 15th on these items. This one makes us take a hard swallow. This list includes laptops, toys, clothing…you get the picture. This list has the makings of real pain for the consumer, for retailers, for wholesalers, for factories in China, etc. The damage will be all over the place. Companies are scrambling to ship products early and evaluate how much and on which products to increase prices. The impact will begin in 4Q but the real damage to corporate profits will be in 2020. Of course, barring a tweet from the President that cancels the tariff.
That last statement about the power of a simple tweet cannot be understated. We have experienced dramatic market swings on even the most innocuous tweets from President Trump. The frequency and severity of these tweets creates unease. Investors without proper investment processes and risk management discipline can be easily fooled. But perhaps more importantly, these tweets are creating uncertainty and shaking confidence in what today is still a very strong economy. The greatest risk to the market is not the ongoing global supply chain rearrangement, it is the possibility that a decline in confidence begets a recession. Could it be that ultimately, we put ourselves into a recession?
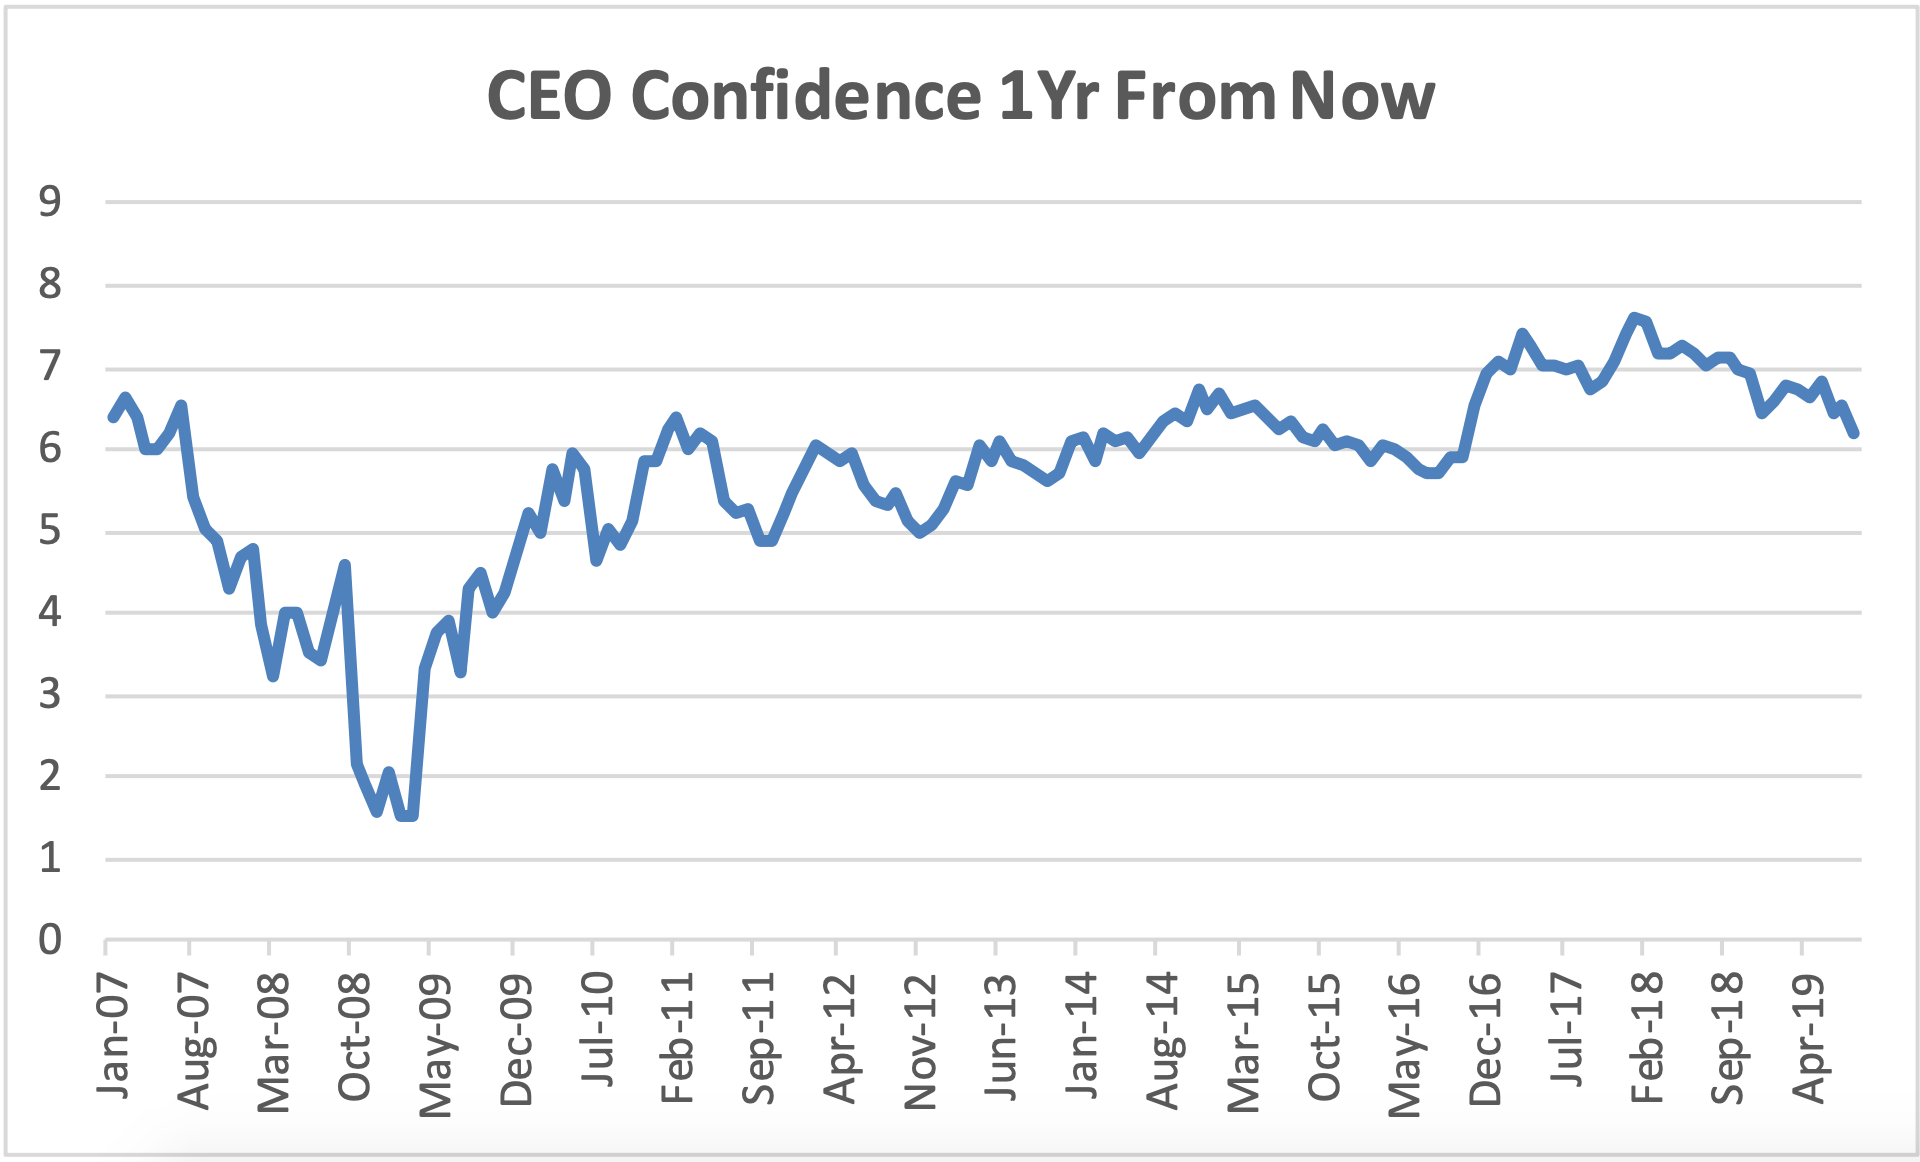
Source: Bloomberg.
We think that is a very real possibility. CEO confidence is already shaken and that may be enough alone. Time and time again on earnings calls we heard CEOs describe in different ways the same problem. No one is sure of the rules governing global trade. Recall, tariffs have also been threatened on Mexican, Canadian and European goods. When CEO’s cannot set a strategy and confidently place investments behind it, ultimately, growth eventually slows, profits decline and then workers lose jobs
In search of optimism, the markets have looked to monetary policy to prevent recession and an associated asset price correction. The jury is out on whether they will be successful this time. Although we are generally skeptical of the Fed’s ability to prevent recessions, we know from the Great Recession that they have the will and means to prevent a 2008-style asset value dislocation. They have liquidity bazookas and a precedent for using them.
A Likely Base Case
We believe that one by one, developing economies are falling into recession. We also believe that the U.S. Manufacturing and farming sectors are already in a recession. While we wait and see whether the Services sectors follow, we can be assured that the bond market is way overbid. Long durations have added material amounts of beta in an unprecedented way. We are also very bearish on what we refer to as the Dotcom 2.0 bubble. Venture-backed start-ups with silly business models attained stratospheric valuations. These ridiculous valuations infected investors even in the public market with numerous stocks trading at huge multiples of revenues. We are staying away from these “dream” stocks.
To this end, we see real tail risk in the likes of WeWork. It does not surprise us that they are having a hard time getting public. Their business model is doomed to fail. Long duration liabilities matched with short duration customer contracts. Sounds a lot like Lehman. While the counterparty risk associated with WeWork is nothing like Lehman, it bears mention that WeWork is the largest tenant in London and New York City, among others. It’s hard to wrap my head around that much square footage coming up for lease all at once. Anyway, that’s a discussion for another day.
Concluding Thoughts
We believe we have a clear view on what data is important. We are vigilantly watching that data and watching for any signs requiring course correction. Importantly, while we think our current, relatively conservative positioning is appropriate considering what we discussed above, we also know that the pain trade is higher. So, we are constantly challenging ourselves to look for optimistic signs and be opportunistic in adding risk. Patience and Balance continues to be our mantra.
Jim Warner is the Managing Director, Head of Research of Lear Investment Management. Lear is an investment firm founded in 2015 focused on generating returns with measured risk. With a quarter century of experience, his ability to identify attractive investment ideas, construct portfolios and manage risk has resulted in superior outcomes for clients.
The Lear Global Vigilance Strategy is rated 5 Stars by Morningstar and ranks in the top 5% of managers in the Tactical Allocation category.
INFORMATION PRESENTED IS FOR EDUCATIONAL PURPOSES ONLY AND DOES NOT INTEND TO MAKE AN OFFER OR SOLICITATION FOR THE SALE OR PURCHASE OF ANY SPECIFIC SECURITIES, INVESTMENTS OR INVESTMENT STRATEGIES. INVESTMENTS INVOLVE RISK AND ARE NOT GUARANTEED. PAST PERFORMANCE IS NOT INDICATIVE OF FUTURE RETURNS. BE SURE TO FIRST CONSULT WITH A QUALIFIED FINANCIAL ADVISER AND/OR TAX PROFESSIONAL BEFORE IMPLEMENTING ANY STRATEGY DISCUSSED HEREIN.