Summary
- The global economic recovery is happening
- Approximately 50 million workers have been rehired
- The largest technology stocks have driven the market to full recovery
- “Covid” businesses have experienced an earnings acceleration
- Technology valuations are bubbly but can remain higher for longer
- Prepare for the “Recovery” trade but most investors will miss it
- Global supply chains are under repair
- The consumer is a lot healthier than expected
- A second lockdown is unlikely
- The election process is likely going to be messy
- Inflation is a very real possibility
- Welcome to a new bull market for risk assets
Series Remarks
“When Models Break” has three parts. Part 1 set the record straight on what the coronavirus is, its real lethality and the path forward as the economy re-opens. Part 2 provides our current view of the economy and financial markets and our expectations going forward. Part 3 will explore how investing has changed and what we believe will work for the next decade.
Part 1 (“The Virus in Perspective”) was widely read and evoked strong emotions – nearly all positive. Sadly, a few thought we were expressing a political viewpoint. We were not expressing a political viewpoint. People were desperate for answers, so we shared our research. We believed our best, most compassionate use – our purpose – was to use our research skills to share knowledge because knowledge is the antidote to fear. We sincerely hope it helped.
That said, our extensive research on the virus provided an additional benefit in revealing an investment edge for our clients. We have continued to beat the market without taking full market risk. Since that report’s publication, our assertions have been completely verified by the CDC, the WHO, a multitude of scientific studies and the data itself.
Introduction
Recessions share common characteristics, such as unemployment and declining GDP, but rarely start in the same fashion. The uniqueness of this Pandemic Recession is hard to understate. Self- induced lockdowns drove economic conditions on par with the Great Depression. Parallels have been drawn to natural disasters, but we view this crisis through the combined historical experiences of the 9/11 Terrorist Attacks and World War II. Through 9/11 we can study the effects of a complete economic shutdown and how society dealt with the fear of terrorist attacks in returning to normalcy. World War II gave us a study of how a country completely retools its economy to wartime footing and then re-traces that path upon the war’s conclusion.
Historians and politicians will argue for years to come on whether societal lockdowns, which had the effect of putting much of the economy on “pause” for several months, were the right solution to minimize both coronavirus fatalities and economic damage. You might find this MIT study of interest (https://www.nber.org/papers/w27102.pdf). Irrespective of who is right, here is where we are: recovering from Great Depression-like unemployment, kinked-up global supply chains and uncertainty over how much of the damage is temporary versus permanent.
In this report, we will examine where the economy and the financial markets are heading. We believe the global economy is on a synchronous path to recovery reminiscent of that following World War II. Unlike that time, the global economy is beginning to recover even as we fight to contain the coronavirus. V-Day for many will be the ultimate development of a vaccine. But until then, different geographies, industries and even companies will recover at different rates. This lack of homogeneity in the recovery process is reflective of the differing impact the lockdowns and Social Distancing inflicted on business models and, importantly, the amount of fiscal and monetary stimulus injected at the country level.
Our core thesis is based on a very simple observation. There have been 16 previous pandemics and every time the global economy recovered1. So too will the global economy recover from this pandemic and it will do so dramatically faster. With unlimited support from the Fed, trillions of dollars of fiscal stimulus, increasingly more effective therapeutics and a vaccine forthcoming, the economy will recover and full employment restored in relatively short order. Setbacks are to be expected and the speed of the recovery will vary by industry and region, but it will happen and as the prospect of corporate earnings recover financial asset prices will continue to drive higher. To this end, we have already experienced a complete market recovery and believe the stage is set for further gains. We are in a new bull market for risk assets.
State of the Financial Markets
Disaster Averted
The markets in 2020 experienced extraordinary volatility. Over the course of just twenty-three days, the S&P 500 declined 34%2. The speed and severity of the decline was unprecedented and matched the negative economic consequences of the lockdowns. The VIX Index, a commonly used measure of market volatility, reached levels that even exceeded the Great Financial Crisis. Normally safe corporate fixed income assets collapsed in value as credit concerns swept through the financial markets. Margin calls, particularly among CMBS REITs, accelerated declines through forced selling3. Corporate bankruptcy concerns mounted as investors weighed the repercussions of the global economy willingly shutting itself down.
The ferociousness of the declines was reflective of models breaking. Neither the global economy nor individual business models are built to be put on pause and, as such, investment models are not either. Furthermore, when financial leverage is applied these models can break leading to disastrous results.
During the dark days of March, we devised a framework for a market and economic recovery that has played out during the last seven months. The global economy needed Central Banks to backstop the financial markets, Governments to issue copious amounts of fiscal stimulus and the virus to be contained sufficiently to permit economies to re-open. This three-legged stool for recovery as we called it is playing out in every country. In the US, specifically, the speed and size in which both the Fed and Congress acted was extraordinary. The Fed’s swift actions to drop interest rates to zero and provide unlimited QE, created an immediate snap back in credit markets and set the stage for risk-taking (i.e., buying equities). Quick passage by the Federal Government of multiple fiscal recovery programs created a much-needed financial bridge for individuals and businesses to survive the devastating lockdowns until such time as they could re- open again. With two legs of the stool in position by April, the conditions were set for gradual risk-taking.
A Dramatic Comeback
It took less than a month for the S&P 500 to collapse, but just six months later, the market had fully recovered – gaining 51% in the process – leaving many market observers scratching their heads and the bears with much less wealth. How could a market recover this quickly while the economy shed over 60 million jobs during this timeframe and posted a -31.7% GDP in Q24?
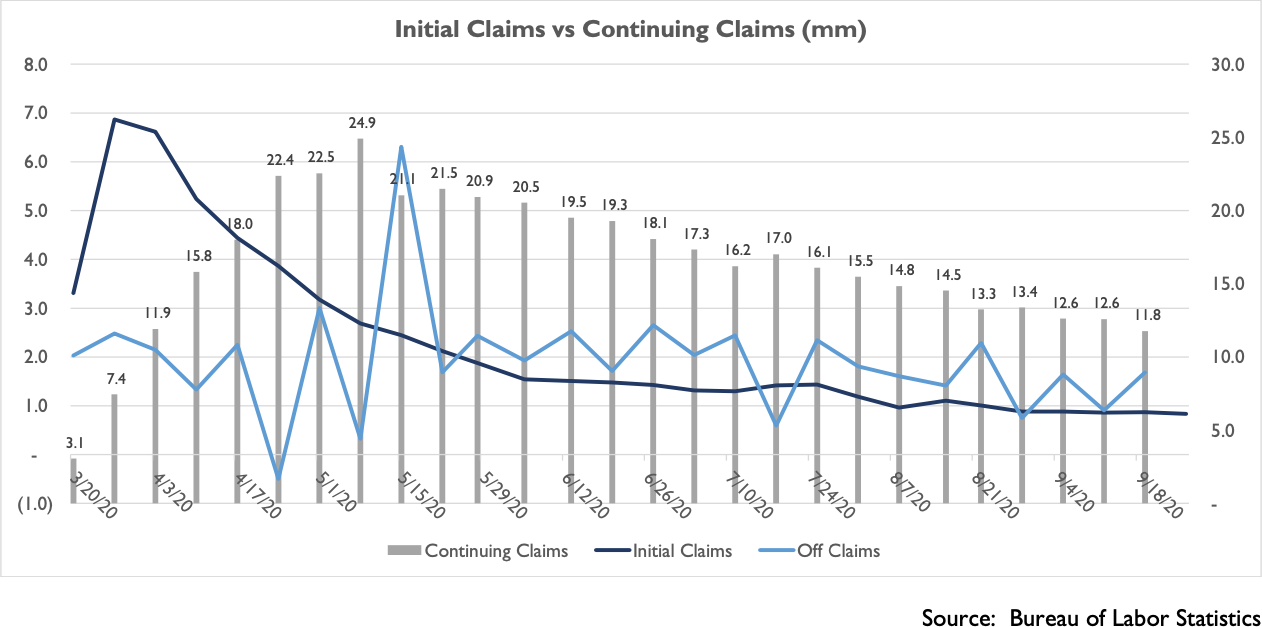
As we wrote a year ago in Warner’s Corner “Predicting the Next US Recession”, the key to understanding the economic cycle is consumer spending and what drives that is jobs. So, our focus was on Initial Jobless Claims. Lockdowns meant layoffs and you could see them coming as first Asia locked down then Europe and finally the U.S. However, there were two remarkable elements to the US layoffs that gave us initial clues about the real severity of the economic damage.
First, under the Worker Adjustment and Retraining Notification Act of 1988 (or “WARN Act”), employers with over 100 employees are required to provide advanced notification to their employeesofmateriallayoffs. These notifications are filed with the state governments and some of these states publicly disclose a list of those companies filing WARN Act notices and the number of employees affected. The notices also include whether these layoffs are permanent or temporary in nature. We were already monitoring this data as the lockdowns began and layoffs spiked.What was extraordinary – at least to us – was in March and April nearly all of the layoffs were labeled as “Temporary”. California is one such example that despite its extreme and early lockdown, employers were evidently optimistic about eventually rehiring their employees5.
Second, these were not normal layoffs. By now we know many individuals received more in unemployment benefits – thanks to the generous CARES Act – than they were getting paid on the job. In addition, many received $1,200 pandemic checks. According to a University of Chicago study, between April and June, 76% of unemployed workers were eligible for benefits that exceeded their lost wages6. While we did not have the benefit of this study during April and May, our channel checks with auto dealers and credit card companies suggested a steep acceleration in spending. Indeed, when the Bureau of Economic Analysis reported that April Disposable Personal Income grew 14.8% there was convincing evidence that the economy was not in a Great Depression after all7. In fact, we were in a Twilight Zone. A bizarre socially distant world with only essential services workers going to work while the unemployed and work-from-home employees were feverishly buying goods from Amazon.
As these bonuses were exhausted, those temporarily laid off needed to be rehired and that required economies to re-open. Our focus shifted then from Initial Claims to Continuing Claims and a derived “Off Claims” figure. After peaking at 24.9 million, Continuing Claims have consistently declined ever since, which is directly related to states re-opening their economies. The bears moaned that millions of people were losing their jobs every week but what they missed was that millions more were being rehired. We capture that in the jagged Off Claims line in the chart below. As there were few Continuing Claims pre-pandemic, a decline in that statistic means that coming off claims equates to becoming employed. Therefore,even though millions were still losing their jobs, millions more workers were being hired. As of today, over 60 million Initial Claims have been filed during this pandemic and nearly 50 million have been rehired.
With the economic recovery underway and a Fed urging investors to take more risk, the equity markets’ rebound has been driven largely by what we call “Covid” stocks. While most businesses sustained substantial damage to earnings during the last seven months, some businesses thrived in our Socially Distanced world. Obvious examples include e-commerce, gaming, biotech, communications, grocery stores, home improvement and even housing. The value proposition of these businesses’ products and services dramatically increased from being attractive to essential when faced with employees working from home. Products and services from companies like Amazon, Zoom, Microsoft and Twilio became overnight must-haves. While technology transitions, like the shift to cloud-computing, became utterly necessary for businesses of all shapes and sizes to function in a work-from-home setting.
The market’s recovery has similarly reflected the lopsidedness of the recovery in business profits. In fact, the performance is so lopsided as to completely distort current market levels. As of today, the S&P 500 is up approximately 5% for the year8. However, on an equal-weighted basis, the index is down -5%. What’s going on?
Today, MSFT, AAPL, AMZN, FB and GOOG/L are the top 5 members of the S&P 500 and they comprise 22% of the entire index. As a group, these technology titans are up approximately 40% this year. When applying their individual performance and weightings to the index9, this group has driven a 7.7% increase in the index this year while the other 88% of index members have collectively generated a -3.3% loss.
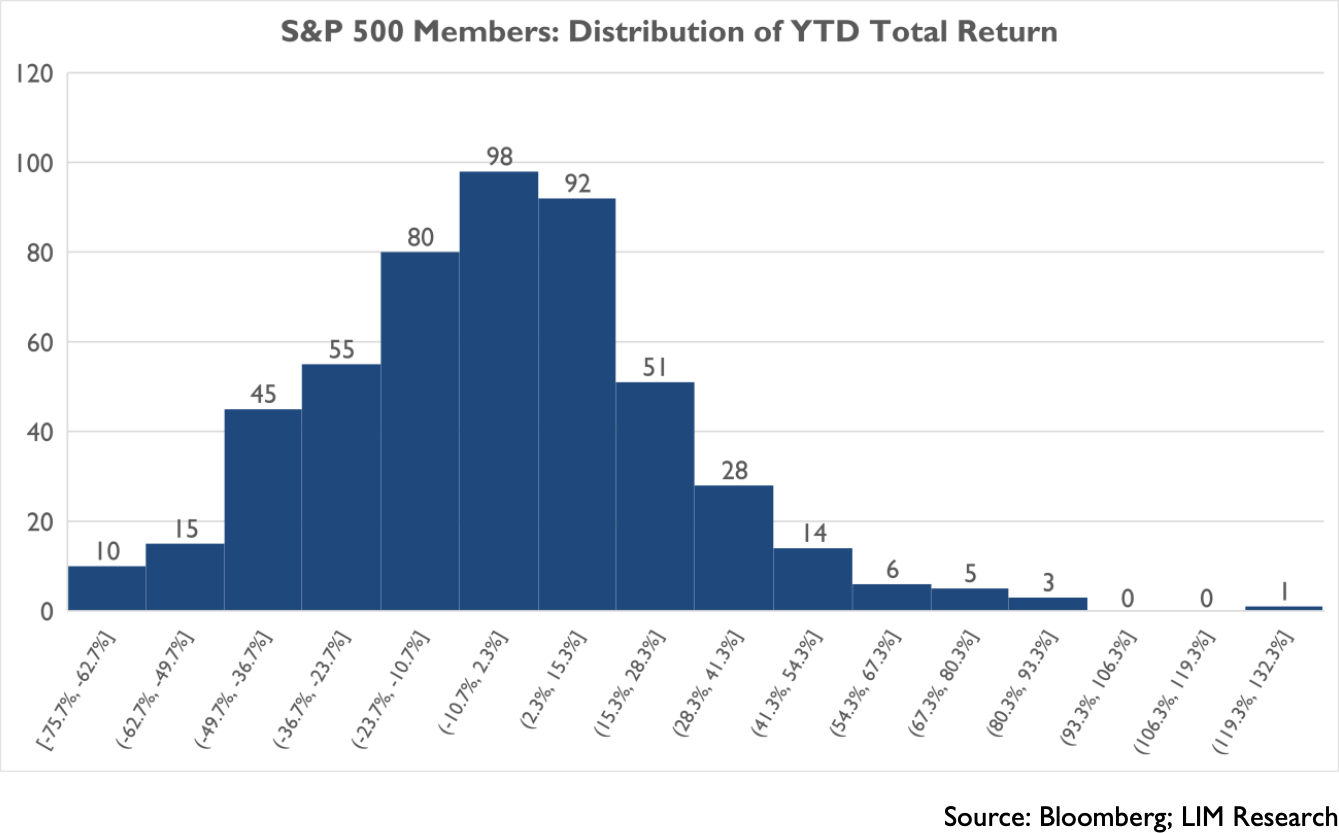
As shown in the histogram above you can see how skewed the YTD returns are for the members of the index. More than half of the S&P 500 members are down on the year and almost 25% are down more than -25%. The remarkable dispersion between winners and losers underscores the importance of stock-picking as opposed to simply buying the index.
This dramatic disparity in performance of Covid versus non-Covid stocks, which include cyclicals and those industries hit the hardest by Social Distancing orders, is reflective of typical investor behavior during a crisis, which is to crowd into those few stocks where earnings power is durable. That behavior , while profitable in the short run, can lead to excessive valuations as investors extrapolate today’s successes to persist into the future. And this is the market we are in today.
The remarkable dispersion between winners and losers underscores the importance of stock-picking as opposed to simply buying the index.
The pullback the market experienced in September was in some measure due to investor concerns over these “Covid” stock valuations. To some extent, this pullback was completely understandable after the enormous surge these stocks experienced in August. For example, Apple rose 40% during August after announcing a non-value creating stock split. Even with the recent correction, the Fed’s continual assurances that interest rates will remain at zero for years to come, forces investors into equities. When this happens, equity valuations expand and can continue to expand to even the frothiest of levels until such time as the Fed changes its tune. So, we believe it is too soon to abandon this trade.
Prepare for the “Recovery” Trade
As mentioned above, there have been 16 previous pandemics and, in every case, the global economy recovered. Now armed with extraordinary scientific and medical capabilities we are confident there will be a day when restaurants, planes, hotels and even stadiums can be filled. People will return to office buildings and consumers to malls.
The imminent discovery and distribution of an effective vaccine will accelerate the economic recovery. Even without a vaccine, better therapeutics and treatments are gradually becoming available to diminish the lethality of the coronavirus. Even as these discoveries evolve, economies are re-opening and restoring jobs to millions of workers. The practical reality is that many individuals are not willing or cannot continue to put life on hold.
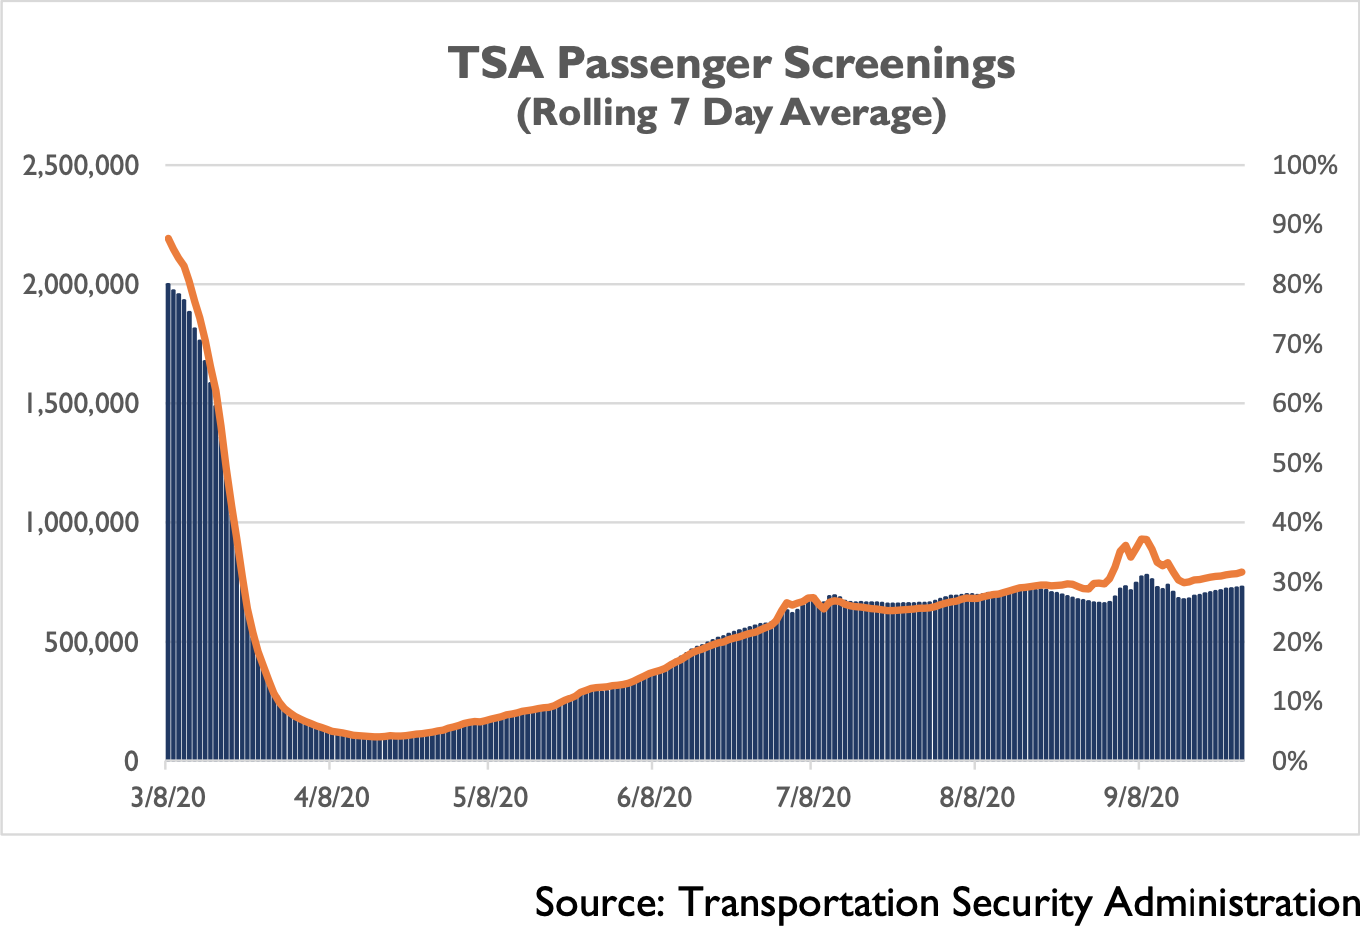
A dramatic example of this is the willingness of people to fly on an airplane. The graph below depicts the 7-day rolling average of passengers passing through TSA checkpoint at U.S. airports10. While still nearly 70% down from pre-pandemic levels, the number of passengers traveling has consistently grown since March. Discretionary travel has not recovered but even one of the hardest hit areas of the economy is making a slow and steady recovery. Consider what happens when a vaccine arrives?
We are not making a case for buying airline stocks right now, however, consider that according to the U.S. Travel Association, 80% of domestic airline trips last year were for leisure purposes11. So, while business trips may have been replaced with Zoom calls for now, travel by air is an ingrained behavior and this data provides an interesting proxy for the willingness of many Americans to participate in what many others consider risky behavior.
Many Investors’ Brains Are Not Programmed for this Trade
Psychologists Timothy Wilson and Daniel Gilbert coined the term “Affective Forecasting” in their seminal research during the 1990s12. In short, they found that how people feel in the present moment blinds them and colors how they expect to feel in the future. This leads to under and over estimations. In other words, our emotional biases today cause us to miscalculate the future. This can lead to “Projection bias”, which is the tendency to project one’s current situation or views into the future at the risk of ignoring conflicting evidence. Another related problem is known as “focalism”. As an American Psychological Association article noted, focalism is our tendency to focus on a single good or bad event in predicting a future event. Further, our psychological immune systems which come to life in times of stress - say, during a pandemic - can influence our judgement even without our realization13.
In September, 22.7% of employed persons teleworked.
There is an underlying anxiety today in society whether it be caused by the coronavirus directly, financial pressures or the lifestyle individuals have had to adopt. It is affecting everyone and by differing amounts. For investors, there is a heightened risk of focalism and, therefore, inaccurately predicting the future. Work-from-home, in our opinion, has only exacerbated this risk as it creates myopia and a lack of physical sensation for how the economy is returning to normal. We never left the office, which afforded us the ability to sense the re-opening as it was happening through slowly higher levels of traffic congestion, restaurants re-opening, etc. The Fed recently released its July 2020 survey results for their “Update on the Economic Well-Being of U.S. Households” and we were surprised to learn that just 31% of workers did all of their work from home in July – down from 41% in April14. In the recently released September jobs report, the Bureau of Labor Statistics reported just 22.7% of employed persons were teleworking15. If that statistic surprises you like it did for us, stop and think about why. Our frame of reference colored our judgement. Now reflect on the 77% of workers that are physically going to work. That equates to approximately 120 million people physically going to work every day and yet there has not been a serious acceleration in coronavirus deaths as many have feared.
A lack of perspective is never good but for investors it can lead to missing significant investment opportunities. For investors that have overlooked the plethora of positive underlying economic developments and the Fed’s insistence on taking risk, they may not make the coming psychological leap into owning stocks that benefit from an economic recovery. In short, the “Covid” trade was the easy safety trade to make although nothing seemed easy five months ago. The next big trade is the rotation into cyclical stocks that are beaten up yet offer potentially extraordinary returns as their business models recover from the demand shock caused by society’s response to containing the pandemic.
This Is Not Just Wishful Thinking...It’s Happening!
Business Formations
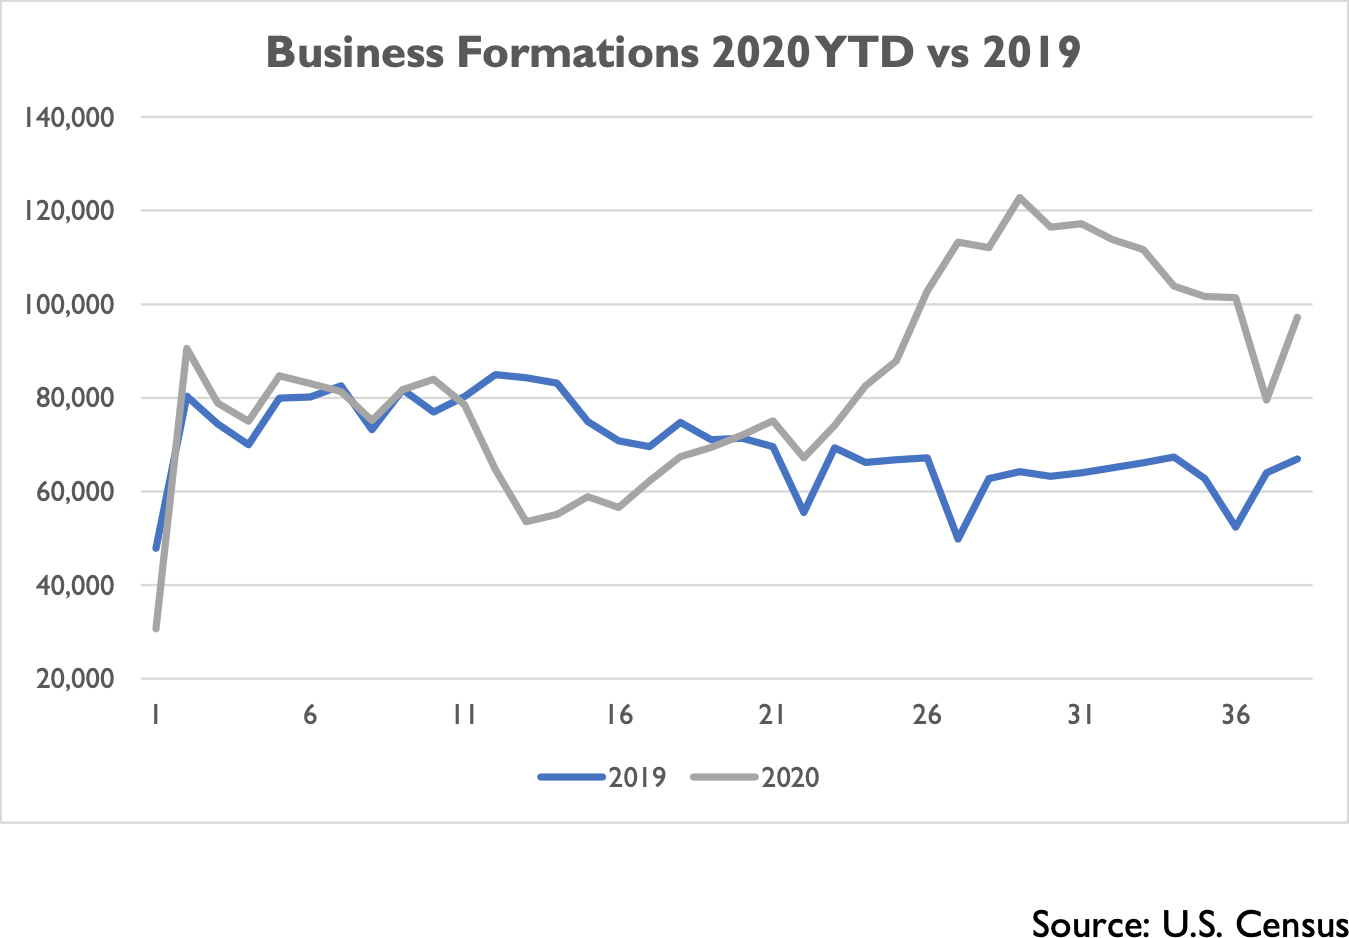
Since May, business formations are up 50% over last year.
Evidence of resiliency in the economy is accumulating. For example, perhaps the last thing you would expect is people STARTING businesses. Yes, not closing but actually starting businesses. The graph below reflects data published by the U.S. Census Bureau on business formations16. Week 12 (the week of March 15th) was the start of nationwide lockdowns which drove business formations down -24% versus the comparable week in 2019. By week 19 (the week of May 3rd) business formations were flat y/y and then began to surge. Since the beginning of May, business formations are up 50% over last year resulting in over 636,000 more business formations.
Global Inventory Re-Stocking
Another important trend is the global re-stocking of inventories. China was the first to shut down factories in February and later European and North American factories followed suit creating a hole in global supply chains. With no new production of goods from cars to clothing for several months, inventories were drawn down. In its September survey, the Institute of Supply Management noted that despite its Manufacturing index showing increasingly higher levels of expansion, the index for Customer Inventories of goods declined to 37.9, which indicates that inventories are “too low”17. This is the second consecutive month of inventories being too low. As the graph below shows, factories have not been able to keep up with customer demand causing inventories to continue to decline. Furthermore, the lack of inventory is widespread. 14 of the 18 industries surveyed reported that inventories were “too low”.
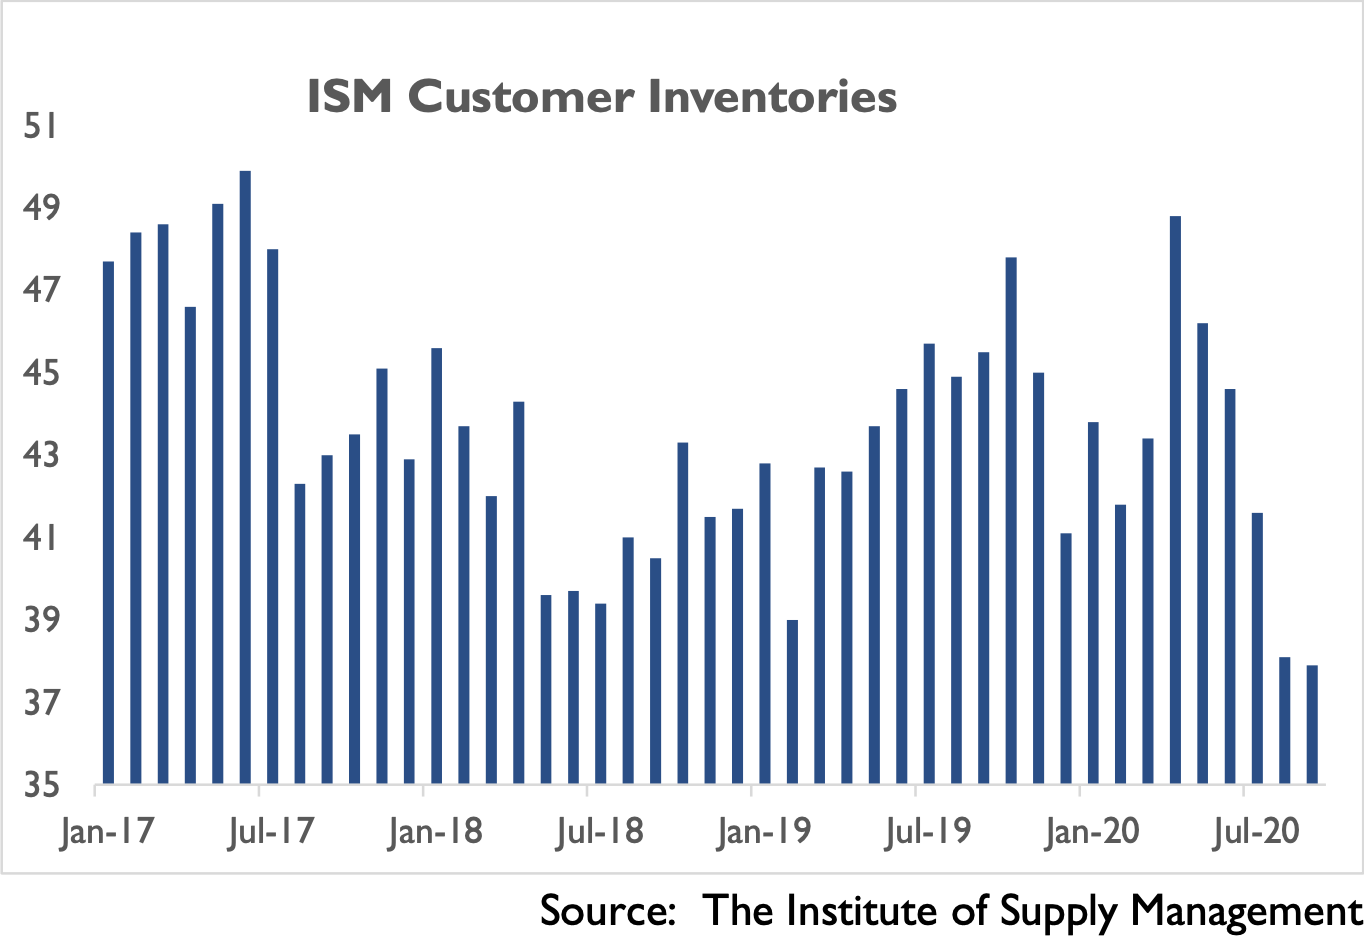
This demand situation is a bullish sign for manufacturers; however, it could mean higher inflation coming through the supply chain. This survey also reported that input prices (e.g., raw materials) jumped to 62.8, which is back to pre-pandemic levels. We will be watching this closely.
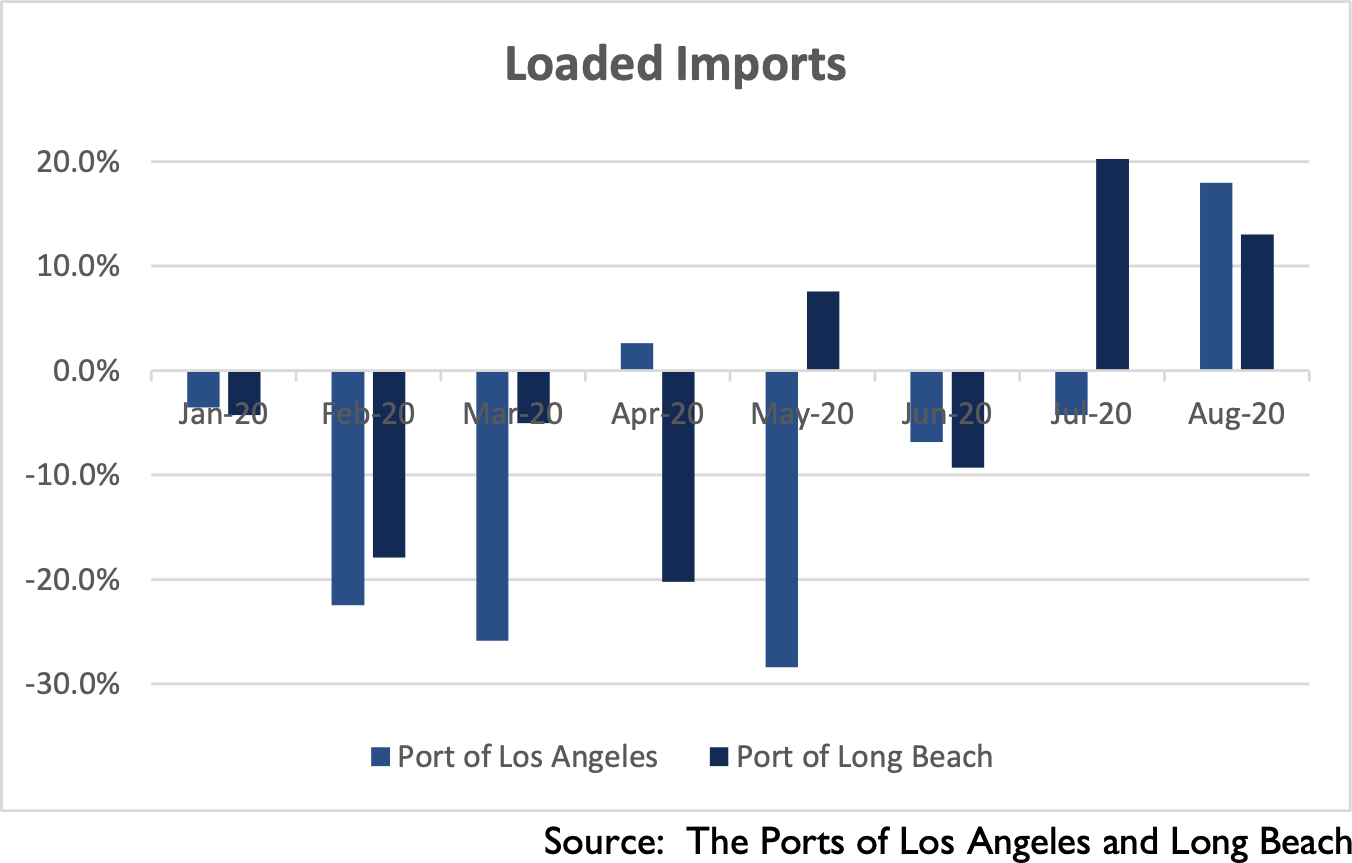
But it is not just domestic factories benefiting from higher U.S. demand, foreign factories are benefiting as well. One way of observing this is through the number of inbound shipping containers being unloaded at U.S. ports. Two of the largest seaports are the Port of Los Angeles and the Port of Long Beach. As depicted below, these ports have experienced a surge since re-opening18 19. In July, the Port of Long Beach reported the highest level of activity in its 109-year opening history. In August, the Port of Los Angeles recorded a 17% y/y increase in inbound container shipments. The re-stocking of America is happening.
Financially Healthy U.S. Consumer
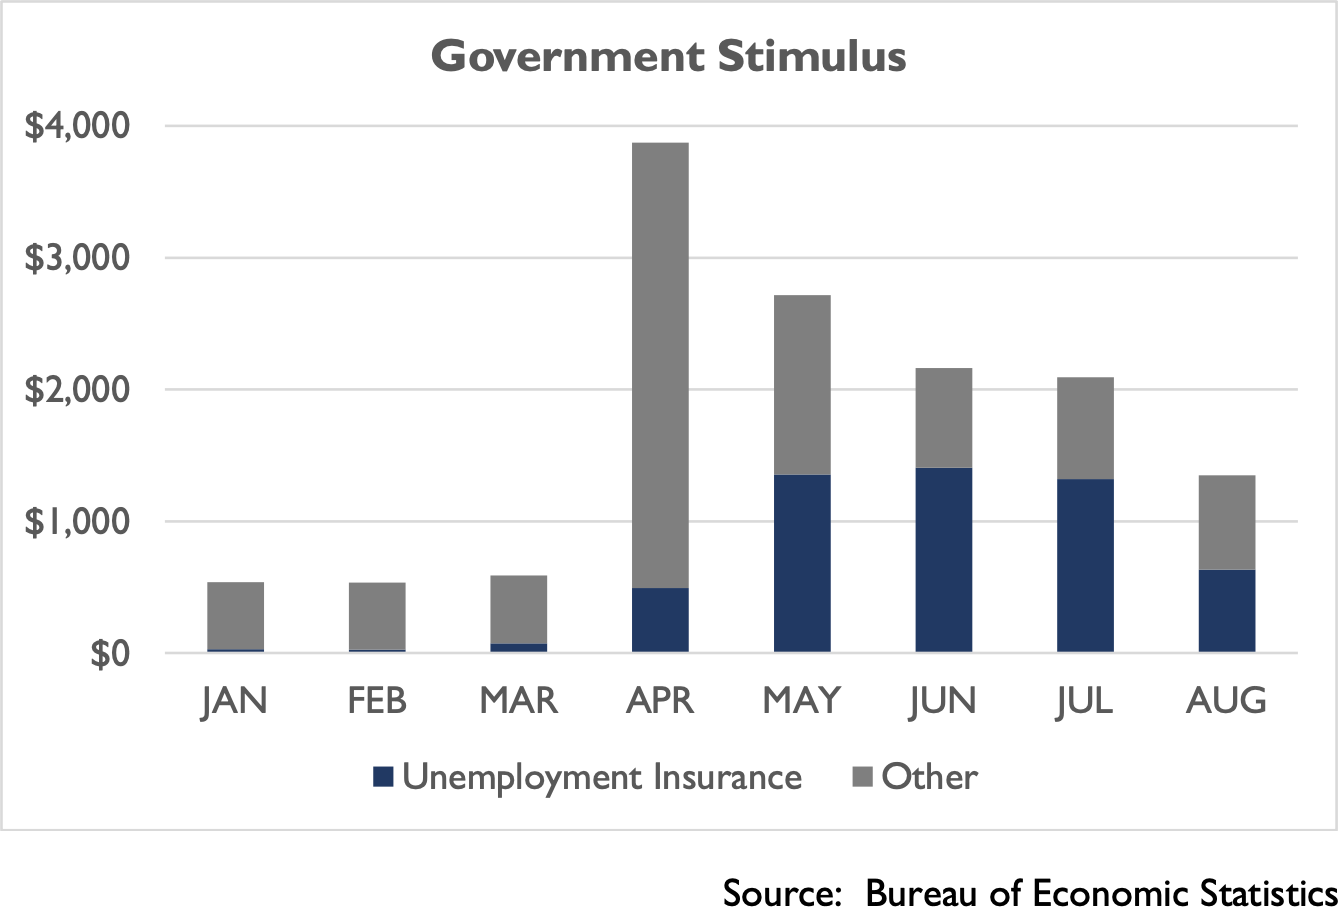
Supporting the resurgence in economic activity is the U.S. consumer’s financial health. What is strikingly different about this recession is that Personal Income has been higher in each month since April than the comparable prior year periods. In August, Personal Income was $19.5 trillion (annualized) up 4.7% y/y from $18.6 trillion in August 201920. As the graph below depicts, the $1,200 stimulus checks (labeled as Other) provided a significant boost to Personal Income in April and May. In addition, unemployment insurance, including the $600 per week bonus (which declined to $300 beginning in August), provided significant added support to Personal Income. Excluding these government payments, Personal Income is only slightly down y/y despite high unemployment rates, which underscores the true strength of the consumer.
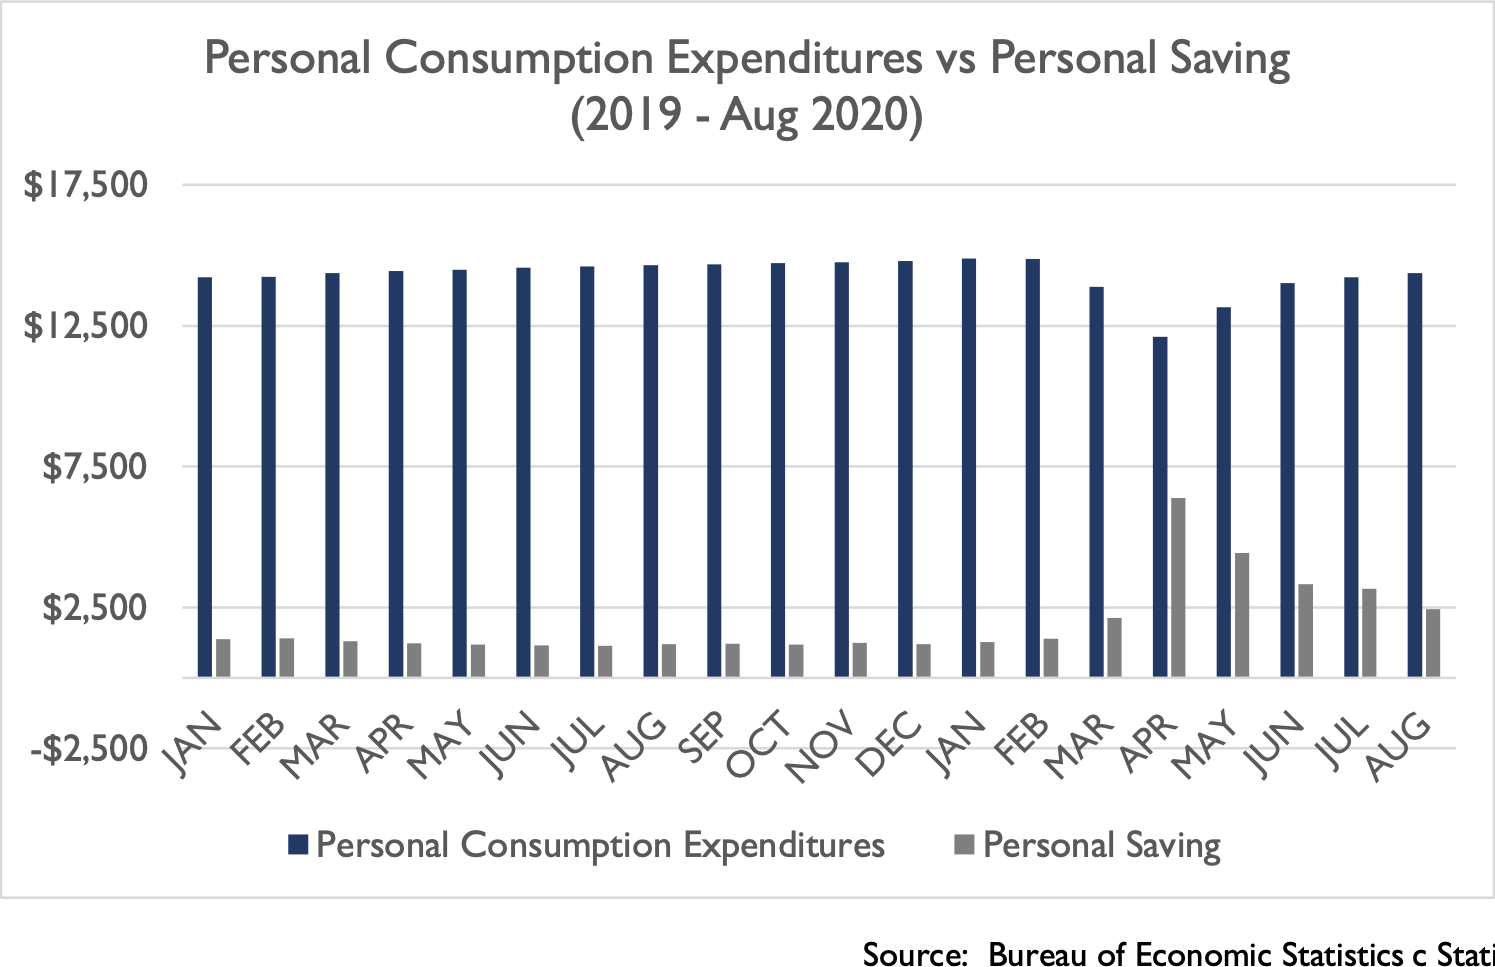
Further, how consumers used their incomes has been surprising. Personal Consumption Expenditures (“PCE”), which reflects consumer spending on all goods and services, has continued to climb back towards pre-pandemic levels. As PCE is approximately 70% of GDP, it is the biggest driver of the economy. As the graph below shows, August PCE rebounded to $14.4 trillion just -1.9% below August 201921. Besides the huge difference in unemployment rates from a year ago, this small deviation is extraordinary because the economy has not fully re-opened. Moreover, there was concern among some market observers that the reduction in the unemployment bonus would cause a sequential decline in spending but instead August consumption was up 1% from July.
A third intriguing aspect of consumer financial health is the unprecedented surge in Personal Savings. To put this in context, Personal Savings in 2019 on average ran each month at $1.3 trillion (annualized). In April, when the $1,200 stimulus checks and $600 per week unemployment bonuses were received, Personal Savings surged to a record $6.4 trillion. Since then Personal Savings has declined steadily each month to $2.4 trillion in August as consumers have either spent the money or have paid down debt.
It is historically unprecedented for consumers to not only save money during recessions but to paydown debt. According to the Fed, outstanding consumer loans, which includes credit card balances, have declined from $859 billion on March 11th to $752 billion on September 16th – a 12% decline22. Specifically, Capital One reported average credit card receivables declined 12.3% during the April-August period23 24. Meanwhile, auto loans increased 5.2% as consumers took advantage of low financing rates to purchase cars. The bottom line is that U.S. consumers are remarkably healthy and have even strengthened their balance sheets during the pandemic.
While the government stimulus checks and bonuses have played a significant role in supporting the consumer, ultimately the most important driver of sustained financial health is employment. The data suggests the use of government stimulus to bridge workers through unemployment to the re-opening of local economies and employment has been largely successful so far. The amount of stimulus was sufficiently large enough to keep Personal Incomes high and the duration of time to rehire has been short enough to create the confidence needed to spend savings. The V-shaped nature of the consumer spending recovery is a major reason why the market has moved higher. However, there is still a risk that when consumers run out of Personal Savings that we see consumption fall and that will be certainly a focus of attention in the coming months. As this risk grows in likelihood, so too will the likelihood of another round of fiscal stimulus.
The Role of the PPP and the Main Street Lending Programs...or lack thereof
Adding to the strangeness of this recovery is how little benefit the Paycheck Protection Program (“PPP”) and the Fed's Main Street lending programs (“MLSP”) have contributed. Both facilities were created as part of the CARES Act. The PPP was aimed at providing a forgivable loan to businesses to pay employees, rent and other eligible expenses. The total program was authorized to lend $659bn of which $525bn was funded25. However, changes to the program after many companies had already been funded has led to confusion and to a lesser extent some concern about violating the terms of the loan. While the precise amount is not known, comments from bank CEOs at a recent investor conference indicated that perhaps as much as $300 billion of these loan proceeds have yet to be spent and are still sitting in checking accounts.
Even worse has been the up take of the MSLPs. The MSLPs were set up by the Fed to lend up to $675bn to eligible businesses that did not take or qualify for PPP money. However, the structure of the three loan facilities is so restrictive that few businesses have qualified. Only $1.1 billion of loans have been funded since they launched the program on July 6th. This program has been a complete bust.
Taken together, there is $808 billion of unfunded stimulus loans plus another approximately $300 billion of funded PPP loans. That is $1.1 trillion of stimulus sitting on the sidelines or the equivalent of 5% of GDP. The lack of success of these programs is not lost on Congress and it is quite possible that Congress may grant Treasury the right to reprogram these unused funds. Just this week, lawmakers in the House and Senate introduced legislation to forgive all PPP loans under $150,000 and the Small Business Administration also announced that it would soon start forgiving loans under $2 million without much scrutiny26. According to the SBA's latest report, there have been 5,183,146 loans funded each under $2 million in size totaling $420 billion27. If these loans are forgiven, the economic recovery could accelerate.
Risks to the Recovery Thesis
As the global economy recovers, there will be some unevenness in growth and there are potential risks that could delay or alter our outlook. We expect there to be volatility as fears of a double dip recession rise and fall. The single biggest risk is a hawkish Fed signaling higher interest rates but that seems very unlikely given their comments. But there are several other risks that should be highlighted.
A Second Lockdown
A second lockdown in the manner of what we have recently experienced would be devastating for the economy and the market. We do not believe this will happen for three reasons:
- Economically inconceivable – The lockdowns in the U.S. caused over 60 million people to lose their jobs and thousands of small businesses to close permanently. A second hard lockdown would create permanent economic destruction as it would be the final blow for many.
- Socially inequitable – The biggest losers in the lockdowns were minorities, women, those without a college education and those earning less than $40,000, according to the Fed's “Update on the Economic Well-Being of U.S. Households”28. School-aged children were also huge losers both from an emotional and educational standpoint. Virtual classes have failed to provide the teaching required to properly educate children and have likely left them months behind in development29. For children without high-speed Internet connections the situation is much more dire. For example, the Dallas Independent School District, the city's vast public-school system, started virtual classes on September 8th with at least 17,450 kids out of 161,000 failing to attend30. If we want to eliminate structural inequality in society, lockdowns are not the way to go.
- Scientifically more advanced – As time goes by, and as we argued in Part 1, the scientific and medical communities have developed substantially more effective treatments for hospitalized coronavirus patients. Better treatments have the effect of narrowing the at-risk population, which then enables more efficient, targeted Social Distancing policies. This evolution in thinking is quite evident in Western Europe today as several of those countries deal with a second wave of cases. Spain is a particularly interesting example. According to data from the European CDC, the first wave of cases (March-May) accounted for 239,375 cases and 27,127 deaths yielding a fatality rate of 11.3%. In this second wave (July-today), there have been more than twice as many cases (508,901) but only 3,259 deaths for a fatality rate of 0.6%31. By now we know that it is likely there were many more cases in the first wave that were not discovered due to lack of testing, so the fatality rate was likely not as high as 11.3%. Nonetheless today's fatality rate of 0.6% is extraordinarily low by any relative measure and strongly suggestive that targeted Social Distancing measures as opposed to lockdowns can be effective at minimizing deaths while preserving jobs.
In Spain's second wave there have been more than twice as many cases but only 3,259 deaths for a fatality rate of 0.6%
Election-Related Volatility
We are often asked about our views on the election and its impact on the financial markets. We are more worried about the election process creating volatility than the actual result. By now the potential issues surrounding mail-in voting and counting these votes are well known and may have contributed to the market's pullback in September. We think it could take weeks to know who won and these weeks could be rancorous.
In the 2000 presidential election between George W. Bush and Al Gore, the fiasco of “hanging chads” in the FLorida vote count forced the election to the Supreme Court. On December 12, 2000, 35 days after Election Day, George W. Bush was declared the winner. The S&P 500 lost - 4% during this period but at one point was down -8%. In fairness, the market weakness may also have been somewhat attributable to growing signs the economy was entering a recession. That said, it is certainly likely and perhaps should be expected that the market will experience some volatility through the end of the year. Any significant weakness will likely be a buying opportunity.
Inflation and Warning to Fixed Income Investors
During the next few months, the U.S. economy is likely to see some unusual volatility in producer and consumer prices. Due to the global manufacturing shutdowns, supply chains are a mess. From raw materials to final goods, inventory availability is spotty, which could lead to inflation. In August, CPI ex food and energy rose a modest +1.7% y/y, however, food prices rose a more concerning +4.1% y/y32. There will likely be product specific price surges in the short run that may suggest higher inflation, but these we believe will be temporary and will normalize once supply chains are restored.
Our bigger fear is looking out a year when real structural inflation could set in. If this happens, it will likely come from one of these sources:
- Strong consumer spending: As discussed above, the U.S. consumer is on average quite healthy and capable of deploying some of its $2.4 trillion of savings. In addition, we believe that structural full employment is achievable within a year. In September, the unemployment rate was 7.9%, which reflects a continuation of its steady decline since April33. As 5% is generally accepted as full employment, that is only 4.6 million jobs away and the economy is only beginning to re-open in populous states like California. According to the Bureau of Labor Statistics, the number of persons on temporary layoff in September was coincidentally 4.6 million, so it may be possible to reach full employment sooner. Moreover, we believe Congress is likely to pass another stimulus package to aid those unemployed, which would help mitigate any potential shortfall in rehiring and, in turn, consumer spending.
- Compliant Fed: The Fed has made several recent announcements that indicate that they may not raise interest rates until 2023. They have also hinted at yield curve management over the next few years, which means that Fed would actively buy longer- dated Treasuries to force a flatter yield curve. Further, the Fed last month made two very important changes to their long run monetary policy guidelines. The Fed has two primary objectives: to maintain moderate inflation of 2% and to achieve maximum employment. Their new guidelines permit inflation to run well above 2% for an unspecified amount of time and changed the way they view employment shortfalls relative to maximum employment with a particular focus on minority unemployment, which tends to lag the broader population. The net result of these changes will permit low interest rates for longer, which increases the prospect of higher inflation.
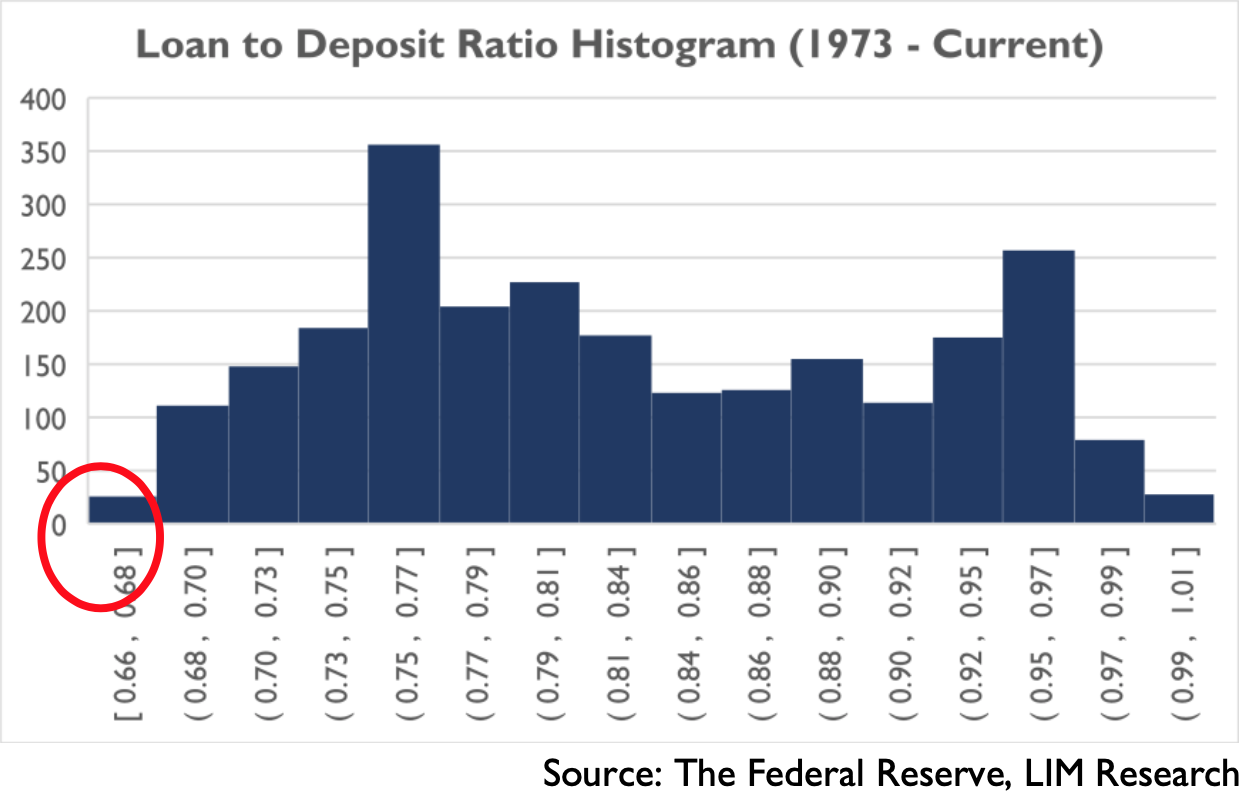
Why would they do this? The Fed is leaning on their experience since 2008 in which their policies were not able to create inflation to meet their 2% target. However, there is a problem with their reasoning. In 2008, the banking system was on the brink of collapse and in the years that followed banks were more focused on repairing their balance sheets than extending loans thereby shirking their fundamental role in the economy. Normally, banks would extend loans to needy customers during times of difficulty and coming out of recessions. This role is not only necessary to help grow the economy by providing needed capital to businesses and consumers, but it also serves as an important monetary policy transmission mechanism. - Strong Bank Lending: In connection with a compliant Fed the banking system is now very healthy and poised to play its role. For every $1 of deposits, a bank can lend out $10. This money multiplier effect is very powerful and if not well understood could stoke inflation. The histogram below illustrates the distribution of weekly loan-to-deposit ratios since 1973 across the banking system calculated from the Fed's H.8 survey34. Today, U.S. banks have a 0.66 loan-to-deposit ratio the lowest level recorded since 1973. What this means is there is enormous unused capacity to make loans in the banking system. If the loan-to-deposit ratio were to normalize to 0.80, all-else-equal U.S. banks could make $19.7 trillion of loans – nearly the size of GDP. If a surge in lending were to occur, the U.S. economy would experience an acceleration in economic growth and inflation.
If inflation surprises to the upside, bond prices will fall substantially from current levels as interest rates at the long end of the curve will increase. Equities and gold, however, will outperform.
Conclusion
There have been 16 previous pandemics recorded in world history and the global economy managed to recover from every one of them. None before had the extraordinary help of robust monetary and fiscal stimulus programs. With this aid and advances made on the coronavirus front, the global economy is re-opening, workers are being re-hired and consumer spending is recovering. The consumer is the engine of the global economy and is surprisingly healthy, which bodes well for continued improvement in corporate earnings. Underlying this recovery story is an extraordinarily accommodative Fed that is forcing investors to take risk that at some point soon will create a rotation out of the relatively safe “Covid” trade and into the cyclical “Recovery” trade. Along the way, there will be pullbacks and bouts of volatility because there always are but patient equity investors will be rewarded. A new bull market for risk assets is here.
Jim Warner is the Managing Director, Director of Research at Lear Investment Management. Lear is an investment and wealth management firm founded in 2015 focused on generating equity-like returns without taking equity risk.
1https://www.history.com/topics/middle-ages/pandemics-timeline
2Source: Bloomberg.
3https://www.reuters.com/article/usa-stocks-mortgagereits-idUSL1N2BH22G
4https://www.bea.gov/news/2020/gross-domestic-product-2nd-quarter-2020-second-estimate-corporate-profits- 2nd-quarter
5https://www.edd.ca.gov/jobs_and_training/warn/WARN-Report-for-7-1-2019-to-6-30-2020.pdf
6https://bfi.uchicago.edu/wp-content/uploads/BFI_WP_202062-1.pdf
7https://www.bea.gov/sites/default/files/2020-05/pi0420_0.pdf
8Source: Bloomberg.
9https://www.ssga.com/us/en/institutional/etfs/funds/spdr-sp-500-etf-trust-spy
10https://www.tsa.gov/coronavirus/passenger-throughput
11https://www.ustravel.org/system/files/media_root/document/Research_Fact-Sheet_US-Travel-Answer- Sheet.pdf
12https://www.psychologytoday.com/us/basics/affective-forecasting
13https://www.apa.org/science/about/psa/2004/04/pelham
14https://www.federalreserve.gov/publications/2020-update-economic-well-being-of-us-households-preface.htm
15https://www.bls.gov/news.release/pdf/empsit.pdf
16https://www.census.gov/econ/bfs/index.html
17https://www.ismworld.org/supply-management-news-and-reports/reports/ism-report-on- business/pmi/september/
18https://www.portoflosangeles.org/business/statistics/container-statistics/historical-teu-statistics-2019
19https://www.polb.com/business/port-statistics/#teus-archive-1995-to-present
20https://apps.bea.gov/iTable/iTable.cfm?reqid=19&step=2#reqid=19&step=2&isuri=1&1921=survey
21https://www.bea.gov/sites/default/files/2020-10/pi0820.pdf
22https://fred.stlouisfed.org/series/CCLACBW027SBOG
23http://investor.capitalone.com/node/42881/html
24http://investor.capitalone.com/node/43361/html
25https://www.sba.gov/sites/default/files/2020-08/PPP_Report%20-%202020-08-10-508.pdf 26 https://www.wsj.com/articles/u-s-to-start-forgiving-ppp-loans-after-borrowers-complained-11601414687?mod=searchresults&page=1&pos=2
27https://www.sba.gov/sites/default/files/2020-08/PPP_Report%20-%202020-08-10-508.pdf
28https://www.federalreserve.gov/publications/files/2019-report-economic-well-being-us-households-update-202009.pdf
29https://www.nytimes.com/2020/06/05/us/coronavirus-education-lost-learning.html
30https://www.dallasnews.com/news/2014/08/25/updated-at-least-17450-kids-are-no-shows-in-dallas-isd-on- first-day-more-expected-in-coming-days/
31https://www.ecdc.europa.eu/en/geographical-distribution-2019-ncov-cases
32https://www.bls.gov/news.release/cpi.nr0.htm
33https://www.bls.gov/news.release/pdf/empsit.pdf
34https://www.federalreserve.gov/releases/h8/current/default.htm
INFORMATION PRESENTED IS FOR EDUCATIONAL PURPOSES ONLY AND DOES NOT INTEND TO MAKE AN OFFER OR SOLICITATION FOR THE SALE OR PURCHASE OF ANY SPECIFIC SECURITIES, INVESTMENTS OR INVESTMENT STRATEGIES. INVESTMENTS INVOLVE RISK AND ARE NOT GUARANTEED. PAST PERFORMANCE IS NOT INDICATIVE OF FUTURE RETURNS. BE SURE TO FIRST CONSULT WITH A QUALIFIED FINANCIAL ADVISER AND/OR TAX PROFESSIONAL BEFORE IMPLEMENTING ANY STRATEGY DISCUSSED HEREIN.