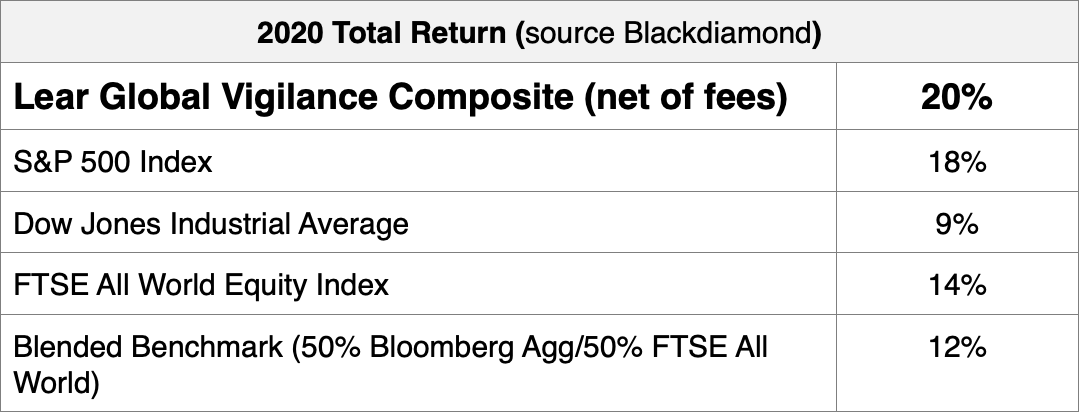
The Lear Global Vigilance Composite returned 20% net of fees for 2020.
The composite achieved the stated goal of delivering equity-like returns with less-than-equity risk.
The Magic Time Machine – The global lockdown spring-boarded the world into a futuristic digitally-connected society. Technology was further ingrained in our lives and became essential to the way people worked, communicated, ordered foods and goods, and even visited the doctor. However, while WiFi was abundant, our modern world experienced shortages of century-old staples - such as toilet paper, canned soup, and jigsaw puzzles. It felt like a trip in a time machine - to the future, then back to the past - even days when it felt like time stood still. In the financial markets, the paradox continued as the stock market experienced strong returns despite the political, social and economic turmoil.
How It Started for Stocks – The decade began innocently enough with the stock market looking to extend the longest bull-run in history. Our research indicated the economy was late in the cycle, and we anticipated 2020 could be a tricky year. The concluding paragraph from our 2019 year-end letter stated our view:
Our team’s rally-cry at the end of 2019 was that it would take “grit” to navigate 2020. Wow, we could not have imagined the scenario that would unfold. The speed, severity, disruption and the catalyst for the end of the economic cycle was breathtaking and truly novel.
Our ability to navigate the uncertain times and post such a strong return can be attributed to a couple of key points:
- Agility – The focus on adjusting the level of risk in the portfolio based on economic and market conditions was key. The portfolio started the year defensively but transitioned to the offensive after the steep decline in stocks.
- Stock Selection – Owning stocks with strong secular tailwinds driving revenue in specific themes was essential to performance in this recession and rebound.
The Whistle Blows on NBA Season – On March 11th, the NBA canceled the season after the Utah Jazz’s Rudy Gobert tested positive for Covid-19. This was the pivotal moment when the severity of the situation hit many Americans, and the start of the bizarro lockdown world. This reality included increased volatility in stocks.
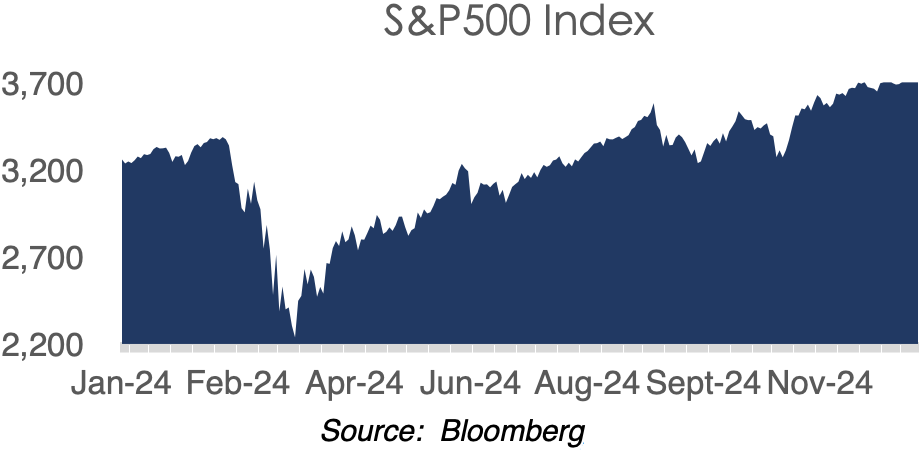
Limit Down – The S&P 500’s decline of 34% was less than the 2008 Great Financial Crisis and the 2000 Dot Com Bust, but the true pain was masked by the strong performance of some of the largest technology stocks (AMZN, AAPL, GOOG, FB, MSFT). Industries like energy, airlines, restaurants and financials were down more than 50% from peak to trough. The chart below displays the quick decline (with two days of 10% “limit down” early closes) and then the rapid rebound of the S&P 500 Index:
Too Innocent to Fail – The sharp decline in March was met by a bazooka of monetary and fiscal stimulus from the Fed and fast action by Congress. Having learned lessons from the 2008 financial crisis, the flood gates were opened to support the financial system and provide liquidity for those most impacted by the lockdowns. The US Government has become the ultimate backstop for businesses affected by the pandemic. Even in the worst global recession in history, many companies were supported by various government programs and did not go bankrupt.
If a cruise operator, shopping mall or an airline can make it through this pandemic, it seems like they are bulletproof.
The Cloud’s Silver Lining – It is hard to imagine the 2020 lockdown without the digital connectivity allowed by modern technology. We believe the roles of cloud computing and WiFi connectivity are underappreciated. Technology allowed the business world and the government to continue functioning. It also helped us communicate with loved ones and deliver entertainment to our houses and phones instantly. A prevalent theme in our portfolio, cloud technology, has been a key driver of growth for the past several years. 2020 was no exception as technology names accelerated their growth and crushed any doubters.
Others Joined the Party – It was not just technology stocks driving the returns in the portfolio. Investments in clean energy and homebuilding stocks joined the party and delivered strong returns.
Presidential Election – After much drama, the conclusion of the November elections was applauded by investors, and the S&P 500 rallied 10% in November and 4% in December. The divisive political rhetoric carried over into the new year with the Georgia runoffs and the storming of the US Capital. The results cemented a Blue Ripple, not a Blue Wave, and markets continued to move higher.
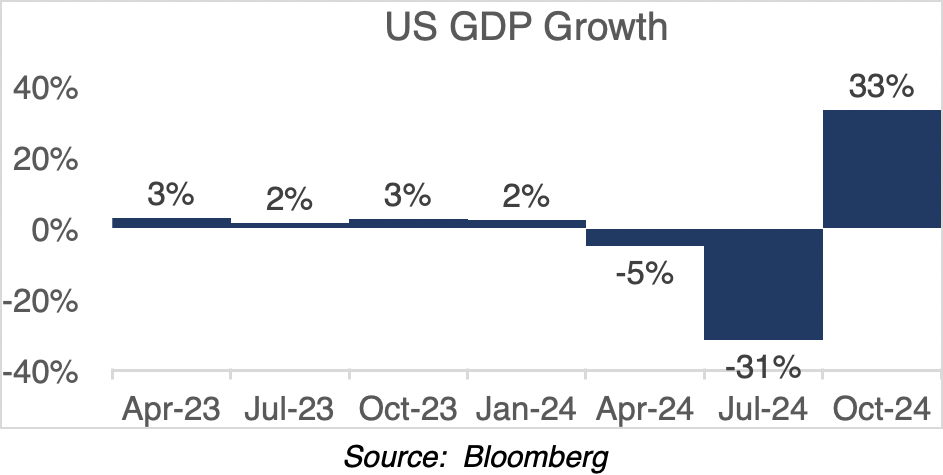
Shortest Recession in History – On the economic front, the economy experienced the largest and fastest drop in GDP in modern history, and then the most rapid rebound. As indicated in the chart below, which displays US GDP by quarter, it was a short, but powerful recession.
PART II – 2021: The Year Ahead
As of January 15, 2021, the S&P 500 price-to-earnings valuation is 24x next 12-month earnings. This suggests investors anticipate brighter days ahead for corporate earnings. Fueled by optimism over several effective vaccines, Federal Reserve support and a new administration in Washington, the market climbed 67% from the lows in March. With the S&P 500 now at levels higher than before the crisis, how should investors be positioned in 2021?
Wall Street Forecast – The consensus for Wall Street analysts is the stock market will be 7% to10% higher at the end of the year. The earnings growth of the S&P 500 is forecasted to be 22% for the year. While we are cautious about agreeing with the consensus, in this case, we do believe stocks are poised to have a positive year with earnings rebounding. However, there are still many concerns in the world. New virus strains must be watched for potential disruptions. And, the Blue Ripple now transfers control of the White House and Congress to the Democratic Party, triggering the possibility of higher taxes. We believe there will be higher taxes, but the raise in corporate and personal income tax rates will be met with further government spending.
While predicting the market is entertaining, we do not believe it is an important exercise for investors. What really matters is the performance of the securities owned in the portfolio. The stock market could have an average year, but like 2020 (and years before), there will be winners and losers.
The Water Is Nice – The conditions for growth are favorable for risk assets. Governments around the world have flooded their economies with fiscal and monetary stimulus. In the US, the Federal Reserve is currently committed to keeping interest rates low to stimulate growth. Also, the government recently passed an additional $900 billion relief package for businesses and individuals most affected by the crisis. This favors risk assets, like stocks and higher-risk fixed income.
Trimming the Fat – In the face of a pandemic, many companies cut spending and became more efficient with the use of Artificial Intelligence, Machine Learning and other productivity-enhancing software. Thus, corporations are poised to have higher margins once business returns to normal. The emphasis of enterprise software also drives the recurring revenue of the software companies offering the productivity-enhancing software.
Spring Break 2021 – We believe once vaccines are administered to more Americans, people of all ages will party like it's Spring Break. The pent-up demand to travel and gather in large groups could drive a massive expansion of select stocks in certain areas, like travel and entertainment.
As the vaccine is distributed, herd immunity will likely set in and cases should start dropping like a rock. Governments (each at their own pace) will start dialing up occupancy rates for venues, such as restaurants, sports arenas and theaters. We believe the captive citizens of the world will leave their quarantine headquarters and spend the dollars they have saved over the past several months.
Reversion to Mean – 2021's obvious losers will be the businesses that return market share they gained in 2020 under lockdown restrictions. Many stocks that performed well under lockdown conditions, like Zoom, Kroger, and Clorox, will revert to more normalized growth or even decline once normal behavior is resumed.
The trickier analysis will be anticipating the behavior of online retail. We believe that there is some permanence to the shift in the consumer behavior of buying online. But even if the fundamentals are more resilient, there will be some market share that returns to more normal behavior, like shopping in a mall as opposed to buying online.
Reality Bites – As with all Spring Breaks, they end with a return to reality. After the celebration of the first sporting event, family reunion or live concert, people will return home and settle back into life. Further, the effects of the massive monetary stimulus could produce a lasting impact in areas of the economy, including:
- Inflation and higher energy prices
- Increase in interest rates
- Difficult comps from a great quarter for tech stocks
- Stretched valuations from euphoric buying of assets, like Tesla and Bitcoin
Corrections Are Normal – It is important to note the S&P 500 returned 32% in 2019 and then 18% in 2020, thus a 10% to 15% pullback would be normal and even healthy. The real quandary for investors is how to defend against a pullback in a portfolio with interest rates on bonds at such low levels, and interest rates and inflation poised to climb. Perhaps the new defense is a deeper understanding of risk and accepting larger declines in the portfolio for shorter periods. This is possible with a brand of research-intensive investing which focuses on understanding the securities owned and their risk in a portfolio. This new brand of investing favors stock pickers as opposed to index investors.
The Rest of the World – According to the World Population Meter, there are 7.8 billion people in the world in 2021 — and, only 328 million of them live in America. As global investors, we look to all stable countries for opportunities to own stocks in rebounding economies. We continue to favor South Korea and India.
Fixed Income – The 10-year US Treasury bond currently yields 1%. While this is off the lows of 0.7%, the yield is still near historic levels. If one believes inflation is a reality and interest rates will move higher, then fixed income could produce a negative return in 2021. A negative real return on fixed income could cause a rotation out of fixed income and into riskier assets. Further, the search for yield could produce demand for higher-yielding equities, like Master Limited Partnerships, REITs and other infrastructure assets.
In Conclusion – While many are looking to time-travel back to the past before the pandemic, we look forward to brighter days in the new year ahead, with many lessons learned from 2020. We're excited about the future, where the events of the past can change the world for the better.
We are poised, battle-tested and ready to tackle the twists and turns over next twelve months. The team will continue to work tirelessly to protect and grow investors' wealth into the decade ahead. We stand behind our view that the 20s could be a very profitable decade for investors open to accepting a new brand of portfolio management.
We toast those working to have a positive impact on the world. We applaud the human spirit driving to solutions as opposed to those spreading hate and panic.
From our team to your family – much peace, health and happiness.
Footnotes and Disclosures
[1] Indices are unmanaged and investors cannot invest directly in an index. Unless otherwise noted, performance of indices do not account for any fees, commissions or other expenses that would be incurred. Returns do not include reinvested dividends. The Standard & Poor's 500 (S&P 500) is an unmanaged group of securities considered to be representative of the stock market in general. It is a market value weighted index with each stock's weight in the index proportionate to its market value.
[2] The FTSE Global All Cap Index is a market-capitalization weighted index representing the performance of the large, min and small cap stocks globally. The index aggregate of around 8,000 stocks cover Developed and Emerging markets and is suitable as the basis for investment products such as funds, derivatives and exchange-traded funds.
[3] Investments in commodities may have greater volatility than investments in traditional securities, particularly if the instruments involve leverage. The value of commodity-linked derivative instruments may be affected by changes in overall market movements, commodity index volatility, changes in interest rates or factors affecting a particular industry or commodity, such as drought, floods, weather, livestock disease, embargoes, tariffs and international economic, political and regulatory developments. Use of leveraged commodity-linked derivatives creates an opportunity for increased return but, at the same time, creates the possibility for greater loss.
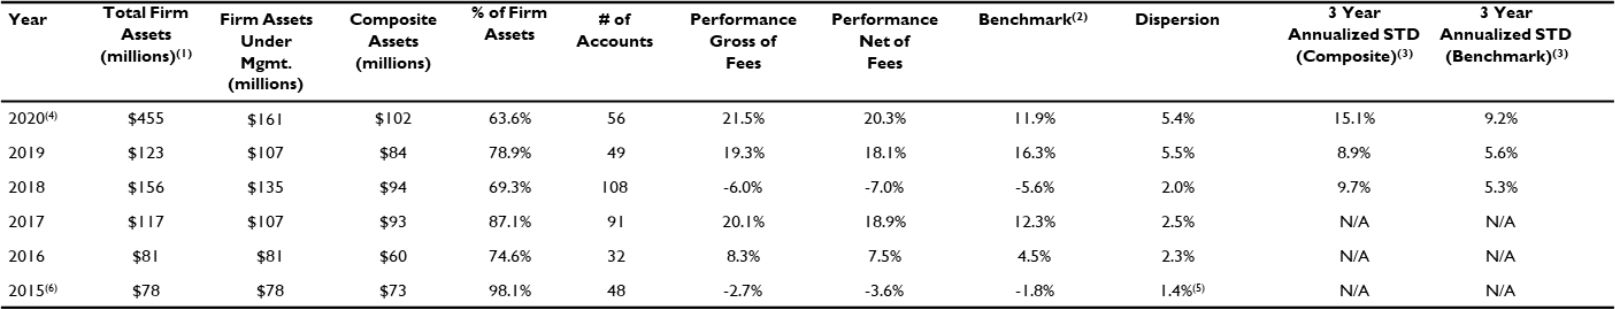
(1) Total includes assets under sub-advisory or model portfolio and assets under management.
(2) The customized Composite Benchmark is currently 50% Bloomberg Barclays Aggregate Bond Index & 50% FTSE Global Equity All-World (gross of foreign withholding taxes on dividends), calculated daily.
(3) 3-year annualized standard deviation. LIM is gross of fees.
(4) Preliminary composite and benchmark performance are for the period 1/01/2020 through 12/31/2020.
(5) Dispersion was calculated using partial year data. N/A - Internal dispersion is not applicable because there were five or fewer portfolios in the composite for the full year. Dispersion is the size of the range of values expected or received around a particular value such as an average.
(6) Composite and benchmark performance are for the period 2/02/2015 through 12/31/2015.
Lear Investment Management (“LIM”) claims compliance with the Global Investment Performance Standards (GIPS®) and has prepared and presented this report in compliance with the GIPS standards. LIM has been independently verified for the periods 02/02/2015 through 12/31/2017. The verification report is available upon request. Verification assesses whether (1) the firm has complied with all the composite construction requirements of the GIPS standards on a firm-wide basis and (2) the firm’s policies and procedures are designed to calculate and present performance in compliance with the GIPS standards. Verification does not ensure the accuracy of any specific composite presentation
Firm Information: LIM is a Registered Investment Advisor based in Dallas, Texas and registered with the Securities and Exchange Commission. Registration does not imply a certain level of skills or training. LIM is a company with purpose, dedicated to creative and unique thinking. We focus on portfolio valuation and research, along with a superior client experience. We seek to identify investment opportunities by looking at economic factors, security valuation and human behavior. We start with the fundamentals of portfolio management and valuation. Then we build on these fundamentals with unique thinking and creative intelligence-gathering to form a viable investment thesis. We believe this approach leads to dynamic global portfolios with increased return and managed risk. LIM utilizes Charles Schwab & Co. Inc. (“Schwab”), a FINRA-registered broker-dealer, member SIPC, as its custodian of assets. LIM is independently owned and operated and not affiliated with Schwab.
Composite Characteristics: LIM creates strategic portfolios which aim to achieve superior returns with controlled risk over a reasonable time period. Our process is research-focused and aims to identify global economic trends, identify undervalued securities then tactically implement and monitor. The LIM Global Vigilance Composite is a collection of separate accounts managed by LIM. These are actual clients of the firm and are all managed by the Lear Investment Management portfolio management team. The strategy is global (US and abroad) equities, fixed income, commodities and cash - depending on market conditions. The composite reinvests dividends. Individual account performance will differ. The composite minimum account size is $100,000. Past performance is not indicative of future results. The composite was created on February 2, 2015. The firm’s list of composite descriptions is available upon request.
Calculation Methodology: Composite returns are calculated by asset-weighting the individual portfolio returns using beginning-of-period values. Composite returns are calculated on a daily basis and geometrically linked to calculate the monthly return. Cash flow timing method: contributions are recorded at the beginning of the day (AM) and distributions are recorded at the end of the day (PM). LIM may use leverage up to 150% of the portfolio net assets as part of investment strategy. Derivatives are generally not used. Depending on the conditions in the financial markets, the firm may utilize options to hedge entire portfolios or a specific security within a portfolio. LIM calculates the asset-weighted standard deviation of the annual gross returns for composites that have six or more portfolios in the composite for the entire year using Black Diamond. LIM’s policies for valuing portfolios, calculating performance and preparing compliant presentations are available upon request. The three-year annualized standard deviation measures the variability of the composite and the benchmark returns over the preceding 36-month period. The three-year annualized standard deviation is not presented for 2015 through 2017 due to less than 36 months of composite and benchmark data.
Benchmark: The customized Composite Benchmark is currently 50% Bloomberg Barclays U.S. Aggregate Bond Index & 50% FTSE Global Equity All-World Index (gross of foreign withholding taxes on dividends), calculated daily.
Net-of-fee Performance: The preliminary net-of-fee performance shown is calculated by Black Diamond (an Advent Company) and reflects the deduction of actual management fees charged by LIM and any applicable trade fees charged by Schwab. Valuations and performance are computed in US dollars, and individual portfolios are revalued daily.
Fee Schedule: For Private Clients: 1.00% on the first $10 million of assets under management. 0.90% on assets from +$10 million to $20 million and 0.80% on assets of +$20 million to $30 million. +$30 million is negotiable. Institutional Clients’ fee schedule may vary.