The “Expert Only” sign is posted in ski parks around the world. The sign is a warning the terrain below requires a higher level of skill and experience to navigate. The capital markets over the past year required an “expert” level of investing as the easy money of the past is no longer available. We expect the uncertainty and volatility experienced last year is the new status quo.
The Lear Global Vigilance Composite returned 9.7% (net of fees) for the first quarter of 2019. The composite had an average of 45% in defensive assets (cash, fixed income and gold).
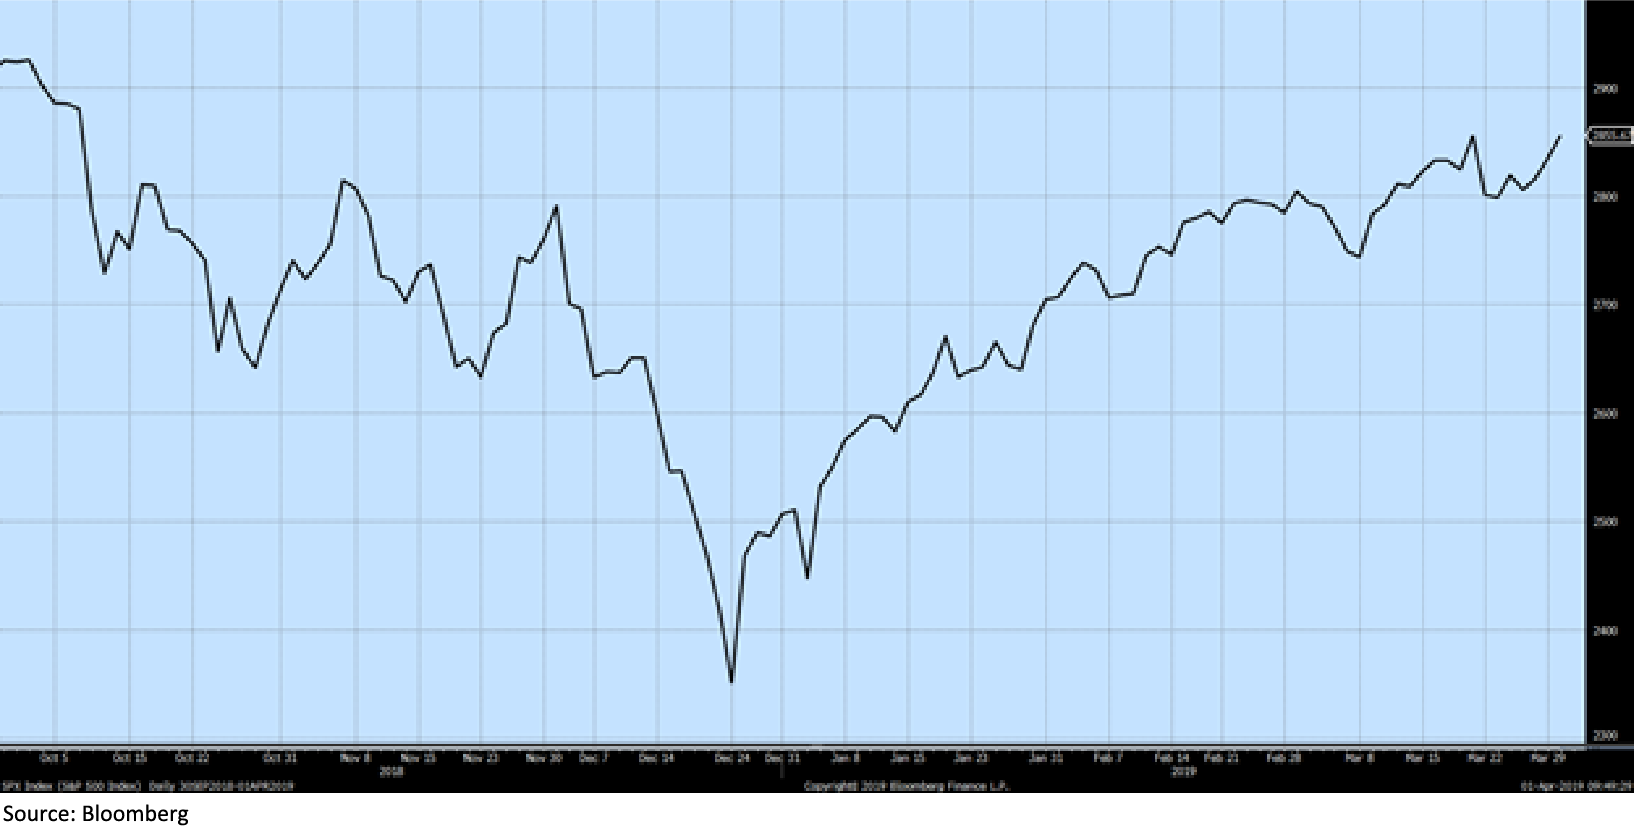
The performance of an investment manager in the first quarter is a sign of their ability to navigate through a challenging environment. During the 20% decline in the S&P 500 in 2018, we pulled from experience and conviction in our research process to recover from the declines. The following is a chart of the S&P 500 from peak in October of 2018 thru March 29, 2019 to illustrate the dramatic shifts in stock prices:
Our strong performance can be attributed to the discipline research process, conviction and experience. While many were panicking in late 2018, we trusted our process and continued to seek securities trading at attractive valuations. Several new stocks were added to the portfolio after the 2018 market correction created many opportunities. These new names fueled the strong performance in 2019.
Stock Stories
As an example of the new names added, we have selected three stocks to highlight with a brief summary of the opportunity:
- Nextstar Media Group (NXST) - This media play owns and operates television stations in smaller markets across the United States. They are currently in the process of becoming the largest station group after it completes a recent acquisition. A critical part of the investment thesis is our belief that political advertising during the election season will reach record levels after a low spend during the last presidential election.
- Sailpoint (SAIL) - This investment falls into the Technology Revolution theme as a play in the identity governance space (cyber-security). Their software allows corporations of all sizes to manage the digital identity of their users. The total revenue for 2018 grew at rate of 34% and we forecast will continue strong growth into 2019 as enterprises continue to look to secure their digital footprint.
- PagSeguro (PAGS) - This fintech company offers mobile payments enabling the vast populations of underbanked individuals in Latin America to engage in cashless transactions both online and offline.
While the companies above are not household names like some others owned in the portfolio, the very fact many have never heard of the stocks is important. As we reach later stages of the market cycle the ability to discover the future leaders trading at attractive valuations will be key to driving returns.
Patience and Balance Revisited
The message in our year-end letter was Patience and Balance for 2019. After the strong start, there are still several challenges looming to the global economy. The most apparent factors to monitor are as follows:
- Federal Reserve – The Fed has signaled a halt to rate hikes in light of weakening macroeconomic data. However, their policy must be watched closely for changes based on developments in the economy. Today, with the dovish pivot, it is a more favorable environment for continued growth.
- US-China Trade Relations – The trade negotiations look encouraging today, but this matter is highly complicated and potential disagreements are expected. This process could continue causing headline risk and uncertainty for longer than expected.
- Brexit – The struggles on the other side of the pond continue as the deadline for the UK departure from the EU rapidly approaches. UK Parliament has frustrated investors and citizens with their inability to agree on an acceptable package for Brexit. Time and patience are running out and we continue to monitor for damage already done to the global economy and the potentially harmful consequences to the global financial system that a Brexit could ignite.
The factors above combined with the late stage of the economic cycle lead us to continue our balanced stance into the second quarter. In such a volatile time, the most important factor is security selection. It is clear the global economy has slowed, but we seek to identify the companies that will thrive in the strong secular themes we have identified to shape the future.
Outlook
There will be a mirage of economic data reported at the end of quarter. We believe the data will be mixed. Perhaps the data point getting the most attention is the yield curve. The inversion of the yield curve has called many economist to warn of an impending recession. We remain as vigilant as ever and are watching this development closely, but have not sounded the alarm as recession does not look probable in 2019.
It is also a possibility that the decline in stock prices in late 2018 was adjustment to stocks prices based on the slowing economic growth and was a vital part of process for the stock market to reach new heights. At the end of the quarter, the S&P 500 was less than 4% from all-time highs.
In conclusion, we are proud of our performance this year, but remain focused down the mountain on the rest of the year and navigating through the expert terrain. The portfolio is well-positioned: with half in defensive assets and half in equities with strong earnings profiles supported by powerful secular tailwinds.
The easy money of the past ten years has been made, it is now time for experienced investing only.
THIS MATERIAL REPRESENTS AN ASSESSMENT OF THE MARKET AND ECONOMIC ENVIRONMENT AT A SPECIFIC POINT IN TIME AND IS NOT INTENDED TO BE A FORECAST OF FUTURE EVENTS, OR A GUARANTEE OF FUTURE RESULTS. FORWARD-LOOKING STATEMENTS ARE SUBJECT TO CERTAIN RISKS AND UNCERTAINTIES. ACTUAL RESULTS, PERFORMANCE, OR ACHIEVEMENTS MAY DIFFER MATERIALLY FROM THOSE EXPRESSED OR IMPLIED. INFORMATION IS BASED ON DATA GATHERED FROM WHAT WE BELIEVE ARE RELIABLE SOURCES. IT IS NOT GUARANTEED AS TO ACCURACY, DOES NOT PURPORT TO BE COMPLETE AND IS NOT INTENDED TO BE USED AS A PRIMARY BASIS FOR INVESTMENT DECISIONS. IT SHOULD ALSO NOT BE CONSTRUED AS ADVICE MEETING THE PARTICULAR INVESTMENT NEEDS OF ANY INVESTOR.
THE STANDARD & POOR'S 500 (S&P 500) IS AN UNMANAGED GROUP OF SECURITIES CONSIDERED TO BE REPRESENTATIVE OF THE STOCK MARKET IN GENERAL. IT IS A MARKET VALUE WEIGHTED INDEX WITH EACH STOCK'S WEIGHT IN THE INDEX PROPORTIONATE TO ITS MARKET VALUE
PAST PERFORMANCE IS NO GUARANTEE OF FUTURE RESULTS. INVESTING INVOLVES RISK, INCLUDING THE LOSS OF PRINCIPAL.
THIS DOCUMENT MAY CONTAIN FORWARD-LOOKING STATEMENTS BASED ON LEAR INVESTMENT MANAGEMENT’S EXPECTATIONS AND PROJECTIONS ABOUT THE METHODS BY WHICH IT EXPECTS TO INVEST. THOSE STATEMENTS ARE SOMETIMES INDICATED BY WORDS SUCH AS “EXPECTS,” “BELIEVES,” “WILL” AND SIMILAR EXPRESSIONS. IN ADDITION, ANY STATEMENTS THAT REFER TO EXPECTATIONS, PROJECTIONS OR CHARACTERIZATIONS OF FUTURE EVENTS OR CIRCUMSTANCES, INCLUDING ANY UNDERLYING ASSUMPTIONS, ARE FORWARD-LOOKING STATEMENTS. SUCH STATEMENTS ARE NOT GUARANTIES OF FUTURE PERFORMANCE AND ARE SUBJECT TO CERTAIN RISKS, UNCERTAINTIES AND ASSUMPTIONS THAT ARE DIFFICULT TO PREDICT. THEREFORE, ACTUAL RETURNS COULD DIFFER MATERIALLY AND ADVERSELY FROM THOSE EXPRESSED OR IMPLIED IN ANY FORWARD-LOOKING STATEMENTS AS A RESULT OF VARIOUS FACTORS.
NEITHER ASSET ALLOCATION NOR DIVERSIFICATION GUARANTEE A PROFIT OR PROTECT AGAINST A LOSS IN A DECLINING MARKET. THEY ARE METHODS USED TO HELP MANAGE INVESTMENT RISK.
INVESTING INTERNATIONALLY CARRIES ADDITIONAL RISKS SUCH AS DIFFERENCES IN FINANCIAL REPORTING, CURRENCY EXCHANGE RISK, AS WELL AS ECONOMIC AND POLITICAL RISK UNIQUE TO THE SPECIFIC COUNTRY. THIS MAY RESULT IN GREATER SHARE PRICE VOLATILITY. SHARES, WHEN SOLD, MAY BE WORTH MORE OR LESS THAN THEIR ORIGINAL COST.
NOTHING CONTAINED HEREIN IS TO BE CONSIDERED A SOLICITATION, RESEARCH MATERIAL, AN INVESTMENT RECOMMENDATION OR ADVICE OF ANY KIND. THE INFORMATION CONTAINED HEREIN MAY CONTAIN INFORMATION THAT IS SUBJECT TO CHANGE WITHOUT NOTICE. ANY INVESTMENTS OR STRATEGIES REFERENCED HEREIN DO NOT TAKE INTO ACCOUNT THE INVESTMENT OBJECTIVES, FINANCIAL SITUATION OR PARTICULAR NEEDS OF ANY SPECIFIC PERSON. PRODUCT SUITABILITY MUST BE INDEPENDENTLY DETERMINED FOR EACH INDIVIDUAL INVESTOR.
LIM claims compliance with the Global Investment Performance Standards (GIPS®). LIM has not been independently verified.
Information presented is for educational purposes only and does not intend to make an offer or solicitation for the sale or purchase of any specific securities, investments or investment strategies. Bloomberg is the source of market data. Investments involve risk and are not guaranteed. Past performance is not indicative of future returns. Be sure to first consult with a qualified financial adviser and/or tax professional before implementing any strategy discussed herein.
| Composite Name | Year | Firm Assets Under Mgmt^ | Composite Assets | % of Firm Assets | # of Accounts | Gross of Fees | Net of Fees | Benchmark | Dispersion |
|---|---|---|---|---|---|---|---|---|---|
| LIM Composite | 2019* | $146,872,049 | $113,866,636 | 77.5% | 119 | 8.94% | 9.66% | 7.17% | 2.74% |
| LIM Composite | 2018 | $134,917,730 | $95,733,196 | 70.9% | 113 | -5.87% | -6.80% | -5.61% | 1.88% |
| LIM Composite | 2017 | $106,732,942 | $93,426,066 | 87.6% | 92 | 20.11% | 18.92% | 12.29% | 2.52% |
| LIM Composite | 2016 | $80,781,889 | $60,233,652 | 74.6% | 32 | 8.60% | 7.53% | 4.46% | 2.25% |
| LIM Composite | 2015** | $77,587,731 | $76,104,332 | 98.1% | 48 | -2.67% | -3.56% | -1.80% | 1.38%*** |
* Composite and benchmark performance are for the period 2/2/2015 through 12/31/2015
** Composite and benchmark performance are for the period 1/1/2019 through 3/31/2019
*** Dispersion was calculated using partial year data. Dispersion is the size of the range of values expected or received around a particular value such as an average.
^ Totaldoesnotincludeassetsundersub-advisory
Lear Investment Management (“LIM”) claims compliance with the Global Investment Performance Standards (GIPS®) and has prepared and presented this report in compliance with the GIPS standards. LIM has been independently verified for the periods 02/02/2015 through 12/31/2017. The verification report is available upon request. Verification assesses whether (1) the firm has complied with all the composite construction requirements of the GIPS standards on a firm-wide basis and (2) the firm’s policies and procedures are designed to calculate and present performance in compliance with the GIPS standards. Verification does not ensure the accuracy of any specific composite presentation.
Firm Information: LIM is a Registered Investment Advisor based in Dallas, Texas and registered with the Securities and Exchange Commission. Registration does not imply a certain level of skills or training. LIM is a company with purpose, dedicated to creative and unique thinking. We focus on portfolio valuation and research, along with a superior client experience. We seek to identify investment opportunities by looking at economic factors, security valuation and human behavior. We start with the fundamentals of portfolio management and valuation. Then we build on these fundamentals with unique thinking and creative intelligence-gathering to form a viable investment thesis. We believe this approach leads to dynamic global portfolios with increased return and managed risk. LIM utilizes Charles Schwab & Co. Inc. (“Schwab”), a FINRA- registered broker-dealer, member SIPC, as its custodian of assets. LIM is independently owned and operated and not affiliated with Schwab.
Composite Characteristics: The LIM Global Vigilance Composite is a collection of separate accounts managed by LIM. Currently the composite holds approximately 60% equities, 35% fixed income and 5% money market. The composite is tracked by Black Diamond (an Advent company). The composite is $114 million dollars of total assets and made up of 119 accounts. These are actual clients of the firm and are all managed by the Lear Investment Management portfolio management team. The strategy is global (US and abroad) equities, fixed income, and cash - depending on market conditions. The composite reinvests dividends. Individual account performance will differ. Past performance is not indicative of future results. Investing involves risk, including the loss of principal. The composite was created on February 1, 2015. The composite minimum account size is $100,000. The composite includes accounts over $100,000, one to three months after inception (depending on how the assets were received). The firm’s list of composite descriptions is available upon request.
Calculation Methodology: Composite returns are calculated by asset-weighting the individual portfolio returns using beginning- of-period values. Composite returns are calculated on a daily basis and geometrically linked to calculate the monthly return. Cash flow timing method: contributions are recorded at the beginning of the day (AM) and distributions are recorded at the end of the day (PM). LIM may use leverage up to 150% of the portfolio net assets as part of investment strategy. Derivatives are not used. Depending on the conditions in the financial markets, the firm may utilize options to hedge entire portfolios or a specific security within a portfolio. LIM calculates the asset-weighted standard deviation of the annual gross returns for composites that have six or more portfolios in the composite for the entire year using Black Diamond. LIM’s policies for valuing portfolios, calculating performance and preparing compliant presentations are available upon request. The three-year annualized standard deviation measures the variability of the composite and the benchmark returns over the preceding 36-month period. The three-year annualized standard deviation is not presented for 2015 through 2017 due to less than 36 months of composite and benchmark data.
Benchmark: The customized Composite Benchmark is currently 50% Bloomberg Barclays Aggregate Bond Index & 50% FTSE Global Equity All-World (gross of foreign withholding taxes on dividends), calculated daily.
Net-of-fee Performance: Net-of-fee performance shown is calculated by Black Diamond (an Advent Company) and reflects the deduction of actual management fees charged by LIM and any applicable trade fees charged by Schwab. Valuations and performance are computed in US dollars, and individual portfolios are revalued daily.
Fee Schedule: For Private Client: 1.00% on the first $10 million of assets under management. 0.90% on assets from $10 million to $30 million and 0.80% on assets of $30,000,001 or more. Institutional Clients’ fee schedule may vary.
This material represents an assessment of the market and economic environment at a specific point in time and is not intended to be a forecast of future events, or a guarantee of future results. Nothing contained herein is to be considered solicitation, research material, or an investment recommendation or advice of any kind.