The market turmoil continues. Last week’s volatility was principally caused by the virus’ spread and increasing concerns of the economic damage being caused. Today, the market is reeling due to Saudi Arabia’s initiation of an oil price war. To avoid burying the lead: DO NOT PANIC. Like our last note, we will explore:
- Stock Market Performance – The VIX!
- The Virus in Perspective – Facts vs Fear
- Possible Economic Outcomes – The Elephant in the Room
We continue to express our deepest sympathies for all those affected by the COVID-19 virus. Our comments herein are reflections on the economic impact of the virus and expressed with great respect for all those affected.
Stock Market Performance – A week ago we started fielding questions from clients urging us to buy the dip. Believe us, we want to but now is not the time. Global equity markets are experiencing very high, crisis-like levels of volatility. To put this into perspective, the market is essentially flat since Friday but in the meantime (see graph below) the S&P 500 experienced some of the most volatile days since the Financial Crisis.
- Monday represented a bounce back from oversold conditions of the prior week and was also probably helped by the White House’s full court press on the news cycle and expectations of a Fed rate cut.
- Tuesday, we got a 50bps rate cut but that was shrugged off as the market considered just how effective rate cuts would be in curing a demand shock to the economy (more on that below).
- Wednesday, the markets rejoiced over Biden’s unexpected Super Tuesday wins. Underlying all of this COVID-19 driven market fear was real concern over Sanders’ momentum. The market unequivocally fears what Sanders would mean for the economy and Biden’s showing and subsequent consolidation of support provided a real sense of relief.
- Each pop in the market was sold as market participants continue to de-risk portfolios. This should not be too surprising as the lofty valuations of the S&P 500 to start February left little room for disappointing news.

The virus outbreak gave investors a reason to take profits in stocks that had a terrific run over the last decade. After the large appreciation of stocks in the 4Q19 (driven by FOMO), a 15-20% decline in stocks is not unordinary. In the past dips, investors have been rewarded for buying stocks. The problem with this dip is that we are not sure yet how much further we need to go to hit bottom.
I wrote that last sentence on Friday and today we woke up to an oil price war which sent stocks down over 7% on the open and tripped the circuit breakers. After a mandatory 15 minute timeout, the U.S. markets re-opened and have bounced a little. The S&P500 touched 2760 which is back to levels not seen since last June. So, the market is now off 17% from the high set on 2/19.
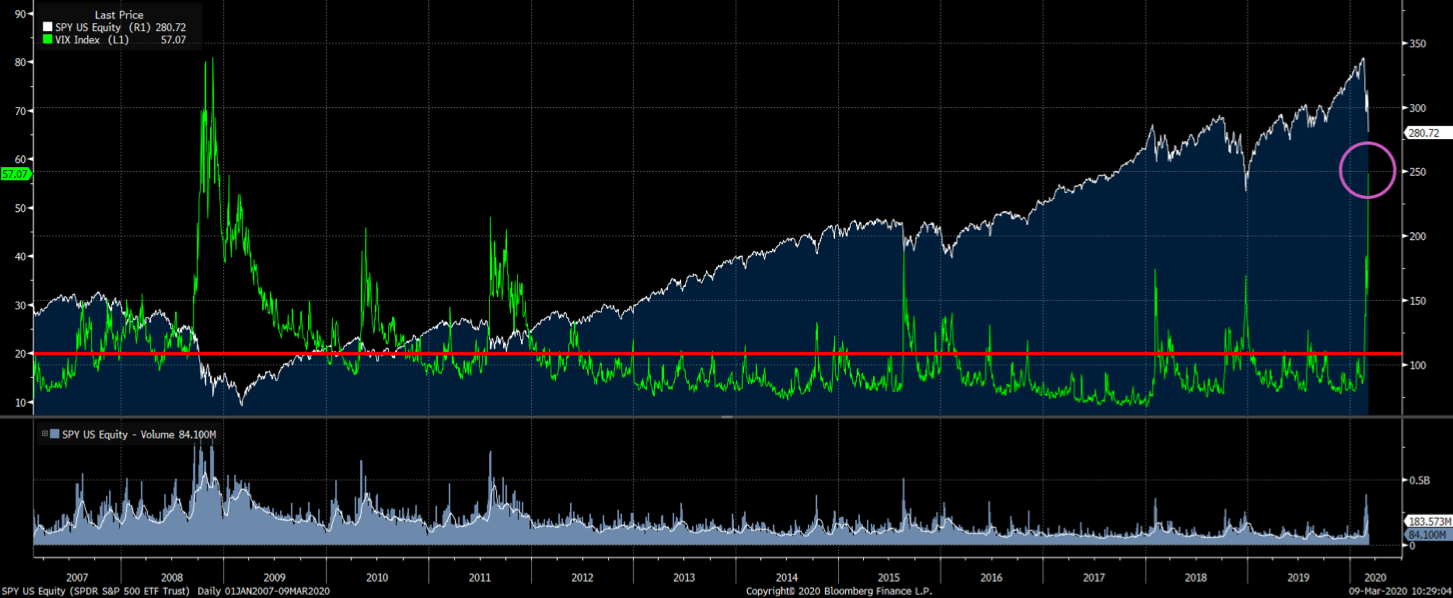
While we are comfortable with the current positioning of the portfolio, the portfolio was further de-risked over the last week. The moves created even more dry powder for when the market turns. The graph below illustrates beyond all the economic impact questions of the virus, the #1 reason why we are not buying more stocks today. It’s the VIX!
The VIX is a measure of market volatility. Technically, it is a calculation designed to measure the expected volatility of the US stock market. It is the best way to measure fear and greed in the market. Depicted below is the VIX dating back to 2007 in order to put today’s volatility into perspective. While we have not – and we don’t expect we will – reach the levels of the Financial Crisis, the VIX in the 60s today is at the levels above the European PIGS crisis, double-dip fears, the downgrade of the US credit rating and the Chinese devaluation. Spikes in fear were in all cases eventually assuaged and calm returned. The best time to buy is when everyone else is freaking out. However, we investors should exercise patience and let that calm return before getting more aggressive.
A natural question then is “So, when are you going to start buying?” We are looking for signs that the economic damage is quantifiable. The tricky aspect of a virus outbreak with no cure is it’s hard to put a time limit on it. We talk below about some of new metrics we are pouring through to get an edge on this but there are two very obvious things that could be put in place.
The best way to cure a virus with no cure is lots of money. Governments around the world will need to embark on large fiscal stimulus programs. What does” building a bridge” have to do with curing a virus? Nothing, directly. But indirectly such announcement will put a stake in the ground that the market can hang onto for confidence that help is on the way. The Fed will also pour liquidity into the system to be sure. Interest rates will probably go to zero.
The second thing required is for the ECB to aggressively step into their markets and support their banks to avert a banking crisis. The problem dates back to the 2008 Financial Crisis. While US banks were aggressively cleaning up their balance sheets as demanded by the Fed by raising capital and writing off bad loans, the European banks never did. They have broadly just “kicked the can down the road” hoping that growth would ultimately save the day. For the last decade, the combination of tepid economic and lax regulators allowed these bloated banks to hobble along. The virus is now causing an economic lockdown that may be the tipping point. We do not believe this will lead to a Financial Crisis. A combination of lower counterparty risk and healthy balance sheets in other parts of the world mean that contagion is not a material concern. But you won’t want to own European bank shares. The ECB will backstop the banking systems and we will likely see equity raises, mergers and perhaps a nationalization or two.
In short, we think big bold actions would be a “cure”.
The Virus in Perspective – Like many others, we are glued to the news on the spread of the COVID-19 virus. The Johns Hopkins real-time monitor is now a permanent fixture on our screens. https://www.arcgis.com/apps/opsdashboard/index.html#/bda7594740fd40299423467b48e9ecf6
Although the virus is still spreading, the pace has decelerated globally. The great fear was that cases would increase parabolically seems to have dissipated somewhat. Clearly containment and early detection efforts seem to be working. It’s too soon to say definitively that we won’t have a reacceleration but there is a clear sense that the general public is aware and taking appropriate precautionary steps. That should give us all hope.
The New England Journal of Medicine published a report a week ago on a study performed on COVID-19 patients from 552 Chinese hospitals. The study looked at the patient data for the period 12/11/19 to 1/29/20, which we know was the worst of the epidemic. The data is largely confirmatory of the WHO and CDC data we have shared but a couple interesting points emerged:
- The median incubation time was only 4 days. This is lower than previously thought.
- Only 16% were severe cases. The rest were non-severe and this is from patients who thought they were sick enough to go to the hospital (or maybe they were force to go as this is China).
One very logical question to ask is can we trust the Chinese data. There are accusations of cover-ups and forged data. We are also closely monitoring daily updates from Korea and Italy. The Korean data is very similar to the Chinese data. The fatality rate is 0.7% similar to that in non-Hubei China. The elderly and those with pre-existing medical conditions accounted for all of the deaths. One staggering piece of data is that all deaths occurred within 3-4 days of contracting the virus. New cases in Korea appear to be in decline and relatively isolated to the city of Daegu. Italy is a newer case so the data is insufficient to draw any real conclusions, but it seems that they were ill-prepared. The death rate thus far is much higher at 5.0% and it is not entirely clear yet why that is the case but it worth monitoring.
Economic Disruption – The containment efforts, which range from quarantining whole cities to avoiding handshakes, is having a negative effect on the global economy. The travel and hospitality industries are particularly impacted. Many companies have banned employee travel and tourists are canceling vacations. From the airlines to UPS to Visa to Apple, companies are increasingly lowering or completely removing their earnings guidance for 1Q and 2020. Many companies in our coverage were at investor conferences last week and, while some are more impacted than others by the containment efforts, no one can yet quantify the longer-term impact on earnings.
We expect more events will be cancelled. For example, South-By-Southwest was recently canceled. This annual event in Austin hosts 100,000 visitors from around the world. Austin’s hotels, bars and restaurants will surely miss the revenue an event like that brings into the city. The virus is changing consumption patterns.
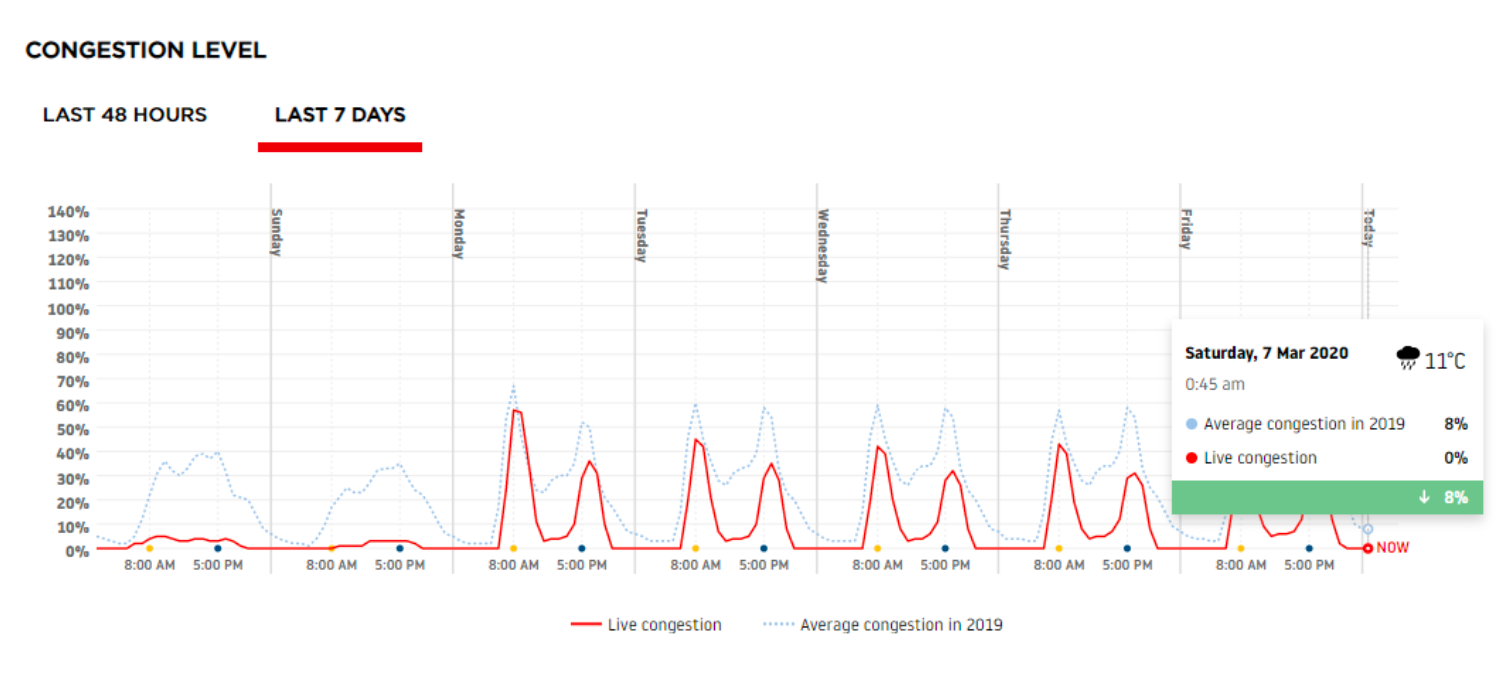
We are looking for clues in China’s economic recovery to apply globally. To that end, we have been monitoring traffic congestion in China’s major cities. Below is a snapshot of traffic congestion in Shanghai. Shanghai is 500 miles east of Wuhan but only a 4-hour ride and a $40 ticket on one of 30 high speed trains that connect the two. Shanghai has experienced 342 cases of which only 24 are active and 315 have fully recovered. That city like many others was on complete shut down until last Monday. Prior to Monday, there was nearly zero traffic congestion. Since Monday, as seen in the solid red lines below, traffic has picked back up as commuters went back to work. Interestingly, the faint blue line below reflects that average congestion level in 2019 for comparison. Note how traffic levels are not fully back to normal but they are well up from near zero. Many companies are still allowing employees to work from home and permitting staggered start times to create less congestion during peak commuting hours.
Major cities in China all reflect similar patterns of traffic normalization with the exception of those located in the Hubei province. This is a great sign as it indicates that consumption and supply chains are also normalizing.
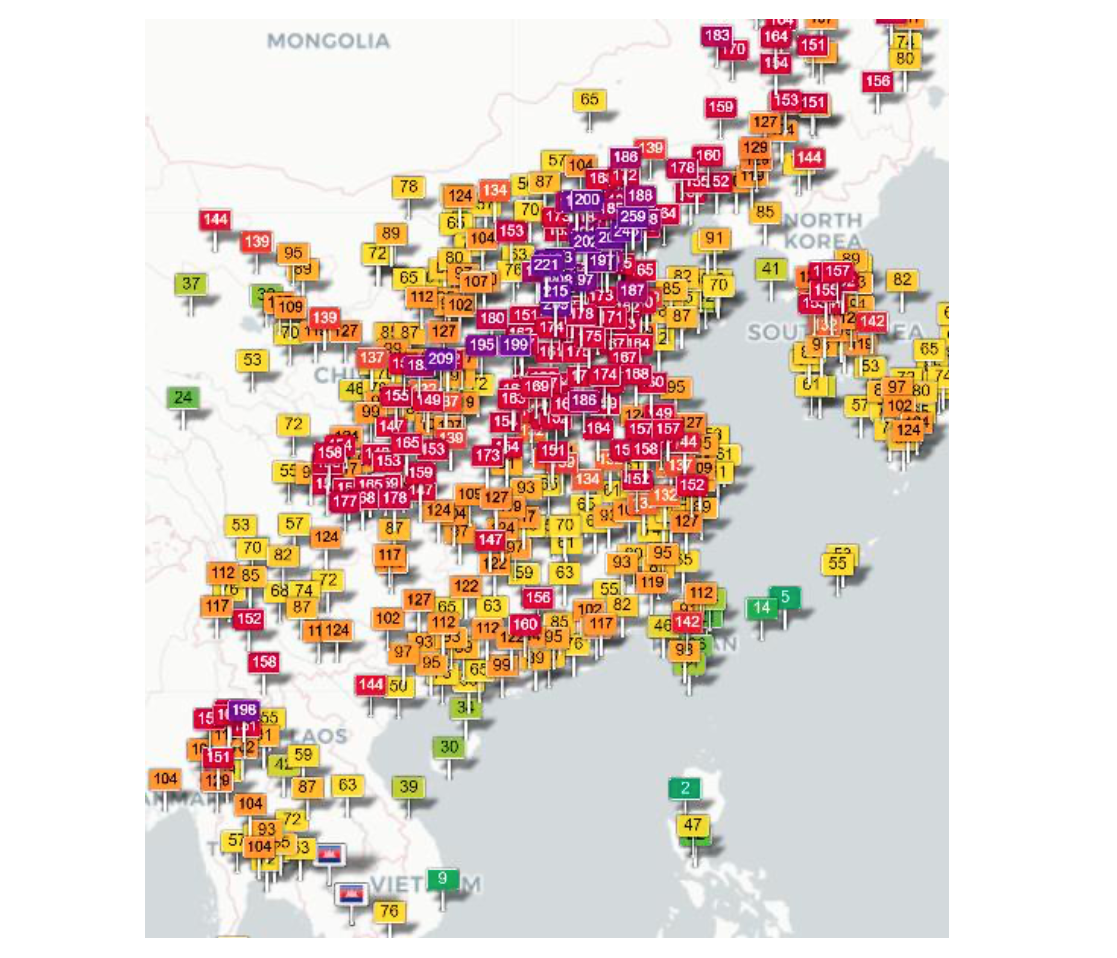
To support this claim, we are also monitoring real-time pollution levels courtesy of the World Air Quality Project. This organization has placed pollution sensors all over the world and there are hundreds in China alone. As you can see in the graphic below, pollution has returned. Green flags and a low number means low pollution. Yellow is worse with Red and Purple signaling very unhealthy levels of pollution. Prior to last week, this map was full of Yellow flags. Now it is covered with Red and Purple. China has gone back to work, which is really incredible considering that the virus was detected less than three months ago. This is important because it tells us that the economic impact is likely temporary and, frankly, not that long.
Conclusion
We remain cautiously optimistic and ever vigilant. While we have significantly insulated our portfolios from the elevated levels of market volatility, we are excited for the opportunity to own generational stocks at much lower valuations than a couple months ago. Until next time, please do not hesitate to call us.
INFORMATION PRESENTED IS FOR EDUCATIONAL PURPOSES ONLY AND DOES NOT INTEND TO MAKE AN OFFER OR SOLICITATION FOR THE SALE OR PURCHASE OF ANY SPECIFIC SECURITIES, INVESTMENTS OR INVESTMENT STRATEGIES. INVESTMENTS INVOLVE RISK AND ARE NOT GUARANTEED. PAST PERFORMANCE IS NOT INDICATIVE OF FUTURE RETURNS. BE SURE TO FIRST CONSULT WITH A QUALIFIED FINANCIAL ADVISER AND/OR TAX PROFESSIONAL BEFORE IMPLEMENTING ANY STRATEGY DISCUSSED HEREIN.