The Lear Global Vigilance Composite returned 18% (net of fees) for the year of 2019.
The composite took substantially less risk than the equity index - the average daily VaR (Value at Risk) was 0.8% compared to 1.4% for the S&P 500[1]. The risk reduction was achieved by the addition of gold, fixed income and low-beta equities. As we approach our 5-year anniversary, our performance track record continues to outpace our index and demonstrates our ability to navigate financial markets to help investors achieve their investment goals.
The closing bell rang on the decade with global stock markets near all-time highs. The strong and surprising performance was a fitting swan song to the decade-long rebound from the Great Recession.
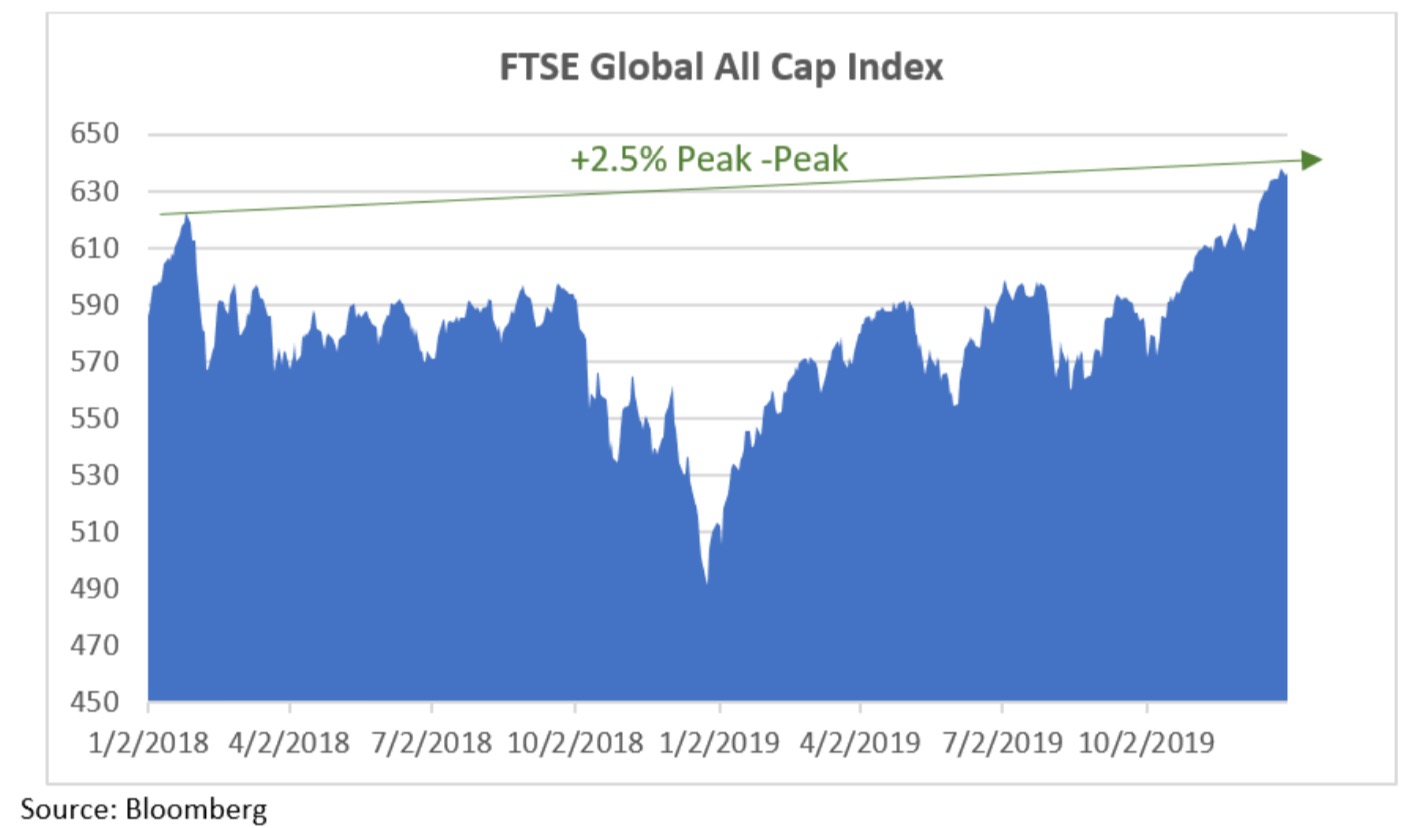
While global stocks posted a strong year, the rebound was after a 15% decline from the peak of 2018. In fact, the FTSE Global All Cap Index[2] closed the year up 28%, but only 2.5% higher than the 2018 peak. Nonetheless, it was a remarkable year in many assets across the globe. The chart below displays the global stock market from 2018-2019:
Before musing on the future, it is important to understand the factors which influenced the past. The following is a review of 2019 followed by our outlook for 2020 and our new investment mantra.
"It is a pivotal time in the world as there is a questioning of capitalism, a search for who is responsible for the negative ramifications of omnipresent technology and the impact of the modern world on the environment. The winners and losers of the next decade will be shaped by how a company navigates these factors."
2019 - The Year in Review
Technology has become omnipresent. Everywhere we look people are glued to their phones. According to the consulting firm Zenneth: “American adults spent about 3 hours and 30 minutes a day using the mobile internet in 2019.” Our lives have become intertwined with technology, and as such, so has investing and even politics.
Technology and Politics Dominated the Headlines
Large technology companies continue to dominate the flow of information. As more of our lives moved online, consumer privacy and dissemination of news became the focus of lawmakers - questioning who is responsible for false information and the appropriate usage of the data collected on-line.
The highly polarized political landscape in the US brought the topic of fake news further into the spotlight. Despite the scrutiny, many technology stocks moved to record highs, suggesting the positives outweigh the negatives. As our largest theme of the past decade, we are proud to report technology remained our largest theme in 2019.
Pass on Grass (and Unicorns)
A key element to generating portfolio returns is avoiding big losses. In 2019, not all technology stocks achieved all-time highs. Several “unicorns” (private companies with valuations above $1 billion) captured headlines with sharp declines. Various high-profile IPOs flopped delivering a dose of reality to lofty unicorn valuations as Uber and Lyft, for instance, closed the year well below their IPO prices.
WeWork’s dramatic decline from a $47 billion valuation to $10 billon in just a month supported our thesis that the “easy money” in venture capital is a thing of the past. In addition to avoiding bubbly venture capital valuations, we avoided the severe revaluation of cannabis stocks. The collapse in Cannabis valuations was reminiscent of Bitcoin’s extraordinary collapse in 2018. In short, there was little margin for error in highly speculative investing in 2019.
Bucking this trend, Beyond Meat was a successful IPO surprising many with mainstream success. The phenomenon of fake meat revealed that consumers are changing behavior and paying attention to the impact their purchases have on the environment. The influence of such mindfulness spread into clean energy stocks and growing adoption of ESG investing.
Easy Being Green
2030 has been identified by various global agencies as the date of “no return” for global warming, causing a 2030 deadline to be the target date for many regulations imposed by governments around the world. For example, the EU has set a target date of 2030 for 50% of electricity generated to originate from renewable energy sources. Regardless of your view on global warming, the deadline is forcing countries to focus on renewable energy sources.
The Great Reversal in Rates
In our opinion, the Federal Reserve was the largest driving force behind the stock market rebound last year. The Fed changed course after seven rate hikes from 2016-2018 and lowered interest rates three times in 2019. The unraveling of monetary tightening resulted in higher multiples for stocks and strong returns for longer dated fixed income. The portfolio benefited from both.
While the performance contribution to the portfolio from fixed income was not as high as that from equities, the double digit returns in several fixed income positions allowed these “hedges” to add to performance. This strategy is an example of how we use hedges to generate risk adjusted returns that complement the stock portfolio.
Out with The Old
2019 taught some investors a painful lesson - mindlessly relying on old economic recession indicators can be misleading, particularly given ultra-low global interest rates. Many investors used the yield curve inversion and falling Purchasing Managers Indices as a signal to sell stocks as they feared a recession was imminent. Such reactionary selling was clearly misguided.
Multiple Expansion
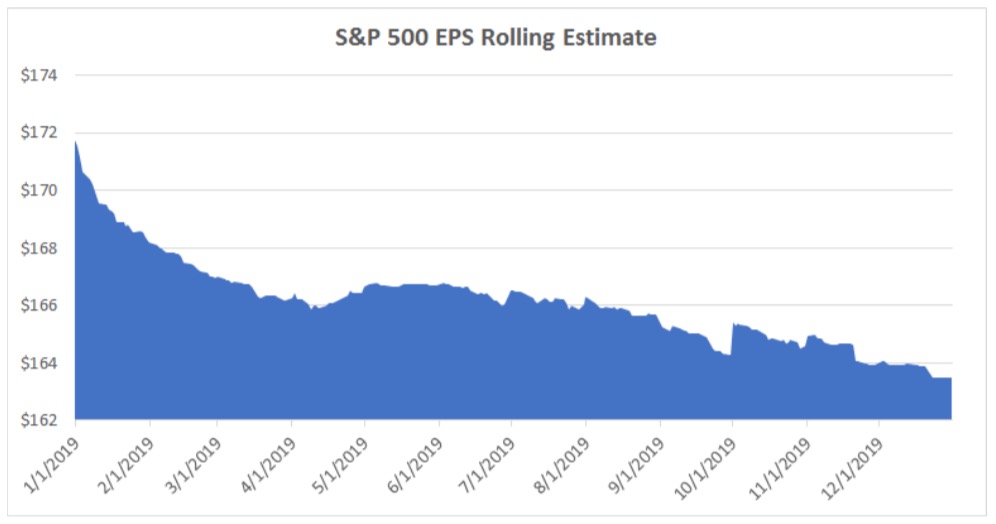
The forward price-to-earnings (P/E) multiple for the S&P 500 (“SPX”) is now 18.5x. This appears high based on historical standards, but in periods of low interest rates, it is still very reasonable if earnings growth can now reaccelerate. Multiple expansion drove the entire move in the SPX this year. The Next 12 Month P/E for the SPX grew 29% during the year. Meanwhile, the next 12-month earnings per share estimates have steadily declined.
Global Trade
The US-China trade dispute dominated headlines throughout the year and contributed to volatility. It is possible the Phase One deal could fuel a rebound in the global economy.
In Summary
We began 2019 with a mantra of “Patience & Balance”. The two main concerns were Federal Reserve and US-China relations. Today, with increased clarity on both matters, we look to 2020 with a renewed focus on stock-specific earnings.
In light of the rapid appreciation in equity index in 2019 from multiple expansion rather than earnings growth, corporate earnings in the coming year will be of upmost importance. Those stocks bid-up to lofty valuations will be punished if they do not deliver on earnings. We believe 2020 will be the year of in-depth research, deep thinking, experience and pure GRIT.
2020 Investment Outlook
Achieving outperformance in 2020 will require a new brand of investing - one without a static risk budget like ETF models or hedge funds. There are a lot of Financial Advisors out there “planning.” Planning is the easy part often performed by generic technology platforms. But, who is out there “doing?” Executing the plan by navigating the financial markets is the hardest part - especially when markets decline.
“Anyone can hold the helm when the sea is calm” – Publilius Syrus
Because we are doers by nature, we have adopted the mantra of “GRIT” for 2020. We use GRIT as a double entendre, representing: 1) hard work, perseverance, courage and passion to achieve a goal and 2) an analogy for Global reach, Risk management, Inflation protection and Technology revolution.
Global reach
With the majority of the world’s population outside the US, we continue to find attractive investment opportunities outside the US borders. The largest weighting to stocks continues to be in the US, but we continue to hold positions in Brazil and India, as well as, European dividend paying names. Being invested globally, not only diversifies away some of the risks highlighted above, but a number of other economies in the world are at more attractive earlier stages of the market cycle than the US and carry valuations materially lower than their potential for earnings growth would imply.
Risk management
Risk management will be critical to portfolio performance if volatility increases as anticipated. Our proprietary approach to evaluating risk applies three major filters: risk budget allocation, portfolio construction and individual security performance. Through real-time monitoring and a rules- based approach, we can swiftly adjust risk of the portfolio.
Inflation protection
Higher inflation is common in the late stage of the economic cycle. To defend against inflation, we currently have a portion of the portfolio in commodities[3]. We project an increase in commodity prices in connection with the Phase One US-China trade deal that could spark a resurgence of the US Agriculture sector. In addition, we own gold and gold miner stocks to offer not just inflation protection but as a hedge to geopolitical risk.
Technology revolution
We particularly favor companies capitalizing on the proliferation of information created by 5G, including AI, the Internet of Things, cloud computing, cybersecurity and Kubernetes. The 4th Industrial revolution is a topic we have been discussing in research for several years and the largest effects are still yet to come. Further, we believe a $1 trillion company will someday be created in Clean Energy technology as the world is more mindful of the harmful effects of pollution on the environment.
Conclusion
Proper portfolio construction and the agility to manage through headline risk will be required to outperform in 2020. There are several macro issues that will require a deft hand to navigate, including: US- China trade dispute, US-Iran conflict, prospect of higher inflation, the Presidential election, Iran, potential EU tariffs and Brexit. While we are constructive on our ability to select stocks that will outperform in this sort of environment, we expect that there will be periods of volatility during the year.
We believe the passive form of investing which provided advisors a place to hide last year, will give way to a new brand of investing. 2020 is the year of GRIT.
Footnotes
[1] Indices are unmanaged and investors cannot invest directly in an index. Unless otherwise noted, performance of indices do not account for any fees, commissions or other expenses that would be incurred. Returns do not include reinvested dividends. The Standard & Poor's 500 (S&P 500) is an unmanaged group of securities considered to be representative of the stock market in general. It is a market value weighted index with each stock's weight in the index proportionate to its market value.
[2] The FTSE Global All Cap Index is a market-capitalization weighted index representing the performance of the large, min and small cap stocks globally. The index aggregate of around 8,000 stocks cover Developed and Emerging markets and is suitable as the basis for investment products such as funds, derivatives and exchange-traded funds.
[3] Investments in commodities may have greater volatility than investments in traditional securities, particularly if the instruments involve leverage. The value of commodity-linked derivative instruments may be affected by changes in overall market movements, commodity index volatility, changes in interest rates or factors affecting a particular industry or commodity, such as drought, floods, weather, livestock disease, embargoes, tariffs and international economic, political and regulatory developments. Use of leveraged commodity-linked derivatives creates an opportunity for increased return but, at the same time, creates the possibility for greater loss.
Disclosures
| Year | Firm Assets Under Mgmt^ | Composite Assets | % of Firm Assets | # of Accounts | Gross of Fees | Net of Fees | Benchmark | Dispersion |
|---|---|---|---|---|---|---|---|---|
| 2019** | $106,699,705 | $84,183,484 | 79.0% | 49 | 19.2% | 18.0% | 16.3% | 5.6% |
| 2018 | $134,917,730 | $95,733,196 | 71.0% | 113 | -5.9% | -6.8% | -5.6% | 1.9% |
| 2017 | $106,687,909 | $92,878,336 | 87.1% | 91 | 20.1% | 18.9% | 12.3% | 2.5% |
| 2016 | $80,781,889 | $60,233,652 | 74.6% | 32 | 8.6% | 7.5% | 4.5% | 2.3% |
| 2015* | $77,587,731 | $76,104,332 | 98.1% | 48 | -2.7% | -3.6% | -1.8% | N.A. |
*Composite and benchmark performance are for the period 02/02/2015 through 12/31/2015.
**Composite and benchmark performance are for the period 01/01/2019 through 12/31/2019.
***Dispersion was calculated using partial year data. Dispersion is the size of the range of values expected or received around a particular value such as an average.stock's weight in the index proportionate to its market value.
^Total does not include assets under sub advisory.stock's weight in the index proportionate to its market value.
Lear Investment Management (“LIM”) claims compliance with the Global Investment Performance Standards (GIPS®) and has prepared and presented this report in compliance with the GIPS standards. LIM has been independently verified for the periods 02/02/2015 through 12/31/2017. The verification report is available upon request. Verification assesses whether (1) the firm has complied with all the composite construction requirements of the GIPS standards on a firm-wide basis and (2) the firm’s policies and procedures are designed to calculate and present performance in compliance with the GIPS standards. Verification does not ensure the accuracy of any specific composite presentation
Firm Information: LIM is a Registered Investment Advisor based in Dallas, Texas and registered with the Securities and Exchange Commission. Registration does not imply a certain level of skills or training. LIM is a company with purpose, dedicated to creative and unique thinking. We focus on portfolio valuation and research, along with a superior client experience. We seek to identify investment opportunities by looking at economic factors, security valuation and human behavior. We start with the fundamentals of portfolio management and valuation. Then we build on these fundamentals with unique thinking and creative intelligence-gathering to form a viable investment thesis. We believe this approach leads to dynamic global portfolios with increased return and managed risk. LIM utilizes Charles Schwab & Co. Inc. (“Schwab”), a FINRA-registered broker-dealer, member SIPC, as its custodian of assets. LIM is independently owned and operated and not affiliated with Schwab.
Composite Characteristics: The LIM Global Vigilance Composite is a collection of separate accounts managed by LIM. Currently the composite holds approximately 60% equities, 35% fixed income and 5% money market. The composite is tracked by Black Diamond (an Advent company). The composite is $84 million dollars of total assets and made up of 49 accounts. These are actual clients of the firm and are all managed by the Lear Investment Management portfolio management team. The strategy is global (US and abroad) equities, fixed income, and cash - depending on market conditions. The composite reinvests dividends. Individual account performance will differ. Past performance is not indicative of future results. The composite was created on February 1, 2015. The composite minimum account size is $100,000. The composite includes accounts over $100,000, one to three months after inception (depending on how the assets were received). The firm’s list of composite descriptions is available upon request.
Calculation Methodology: Composite returns are calculated by asset-weighting the individual portfolio returns using beginning-of-period values. Composite returns are calculated on a daily basis and geometrically linked to calculate the monthly return. Cash flow timing method: contributions are recorded at the beginning of the day (AM) and distributions are recorded at the end of the day (PM). LIM may use leverage up to 150% of the portfolio net assets as part of investment strategy. Derivatives are not used. Depending on the conditions in the financial markets, the firm may utilize options to hedge entire portfolios or a specific security within a portfolio. LIM calculates the asset-weighted standard deviation of the annual gross returns for composites that have six or more portfolios in the composite for the entire year using Black Diamond. LIM’s policies for valuing portfolios, calculating performance and preparing compliant presentations are available upon request. The three-year annualized standard deviation measures the variability of the composite and the benchmark returns over the preceding 36-month period. The three-year annualized standard deviation is not presented for 2015 through 2017 due to less than 36 months of composite and benchmark data.
Benchmark: The customized Composite Benchmark is currently 50% Bloomberg Barclays Aggregate Bond Index & 50% FTSE Global Equity All World (gross of foreign withholding taxes on dividends), calculated daily.
Net-of-fee Performance: Net-of-fee performance shown is calculated by Black Diamond (an Advent Company) and reflects the deduction of actual management fees charged by LIM and any applicable trade fees charged by Schwab. Valuations and performance are computed in US dollars, and individual portfolios are revalued daily.
Fee Schedule: For Private Client: 1.00% on the first $10 million of assets under management. 0.90% on assets from $10 million to $20 million and 0.80% on assets of $20,000,001 or more. Institutional Clients’ fee schedule may vary.