Meditation is the practice of calming the mind to improve focus. A mantra is a tool used to remove distractions. An analogy for the usefulness of a mantra is a stick in an elephant’s trunk. An elephant trainer gives the beast the stick to hold in its trunk to keep from grabbing fruits when walking through a marketplace. In investing, it is helpful to have a mantra to remove the noise and focus on one goal: growing investor’s wealth with a controlled amount of risk.
The Lear mantra for 2019 continues to be “Patience and Balance”. The first six months of 2019 provided many potential distractions, but we remained disciplined and focused on our goal. The families we serve have been rewarded:
The 2019 performance for the Lear Global Vigilance Composite is 11.5% (net of fees, ending 6/30/19.) At date of print (ending 7/15/19), the return was 13.1% for the year.
It has been tempting to grab the fruit and get more bullish as the year has progressed, but there are still potential risks. We continued to reposition the portfolio to a more conservative allocation as the second quarter progressed. Select stocks were sold (or trimmed) due to high valuations and were replaced with lower risk positions. The allocation was approximately 50% growth and 50% defensive assets at the end of the quarter.
We are proud to have not positioned the portfolio too defensively (as our performance displays). In fact, new stock positions were added to the portfolio to capitalize on strong secular themes, such as liquid natural gas exports, political ad spending and digital payments. The key to the strong performance is security selection. To achieve the equity-like returns with half of the asset in stocks, the selection is vital.
The key to investing in 2019 is understanding the securities owned, their valuations and the driving factors behind their earnings. We hope you have enjoyed our newest blog, Warner’s Corner, in which we delve into these exciting themes.
Year-end Letter Review — The driving factors cited at beginning of year were the US-China trade and the US Federal Reserve. The following is a review of the two factors, plus a few more pieces of the puzzle.
US-China — After the meeting between Trump and Xi, the stock market applauded the handshake agreement to reopen the trade talks. It is not clear if anything was resolved, but it appears the friendly tone was enough — for now.
The trade negotiation is a long, difficult path and they are far from an actual deal. Those making a prediction for a short-term resolution usually point to the looming US presidential election as motivation for a deal. The factor to watch is the tariff threat on the remaining $300 billion on Chinese imports. If no further tariffs are levied, then it is possible to avoid a recession before the election without a signed deal. President Trump has tweeted a desire to avoid this step.
Irrespective of the timing and shape of a trade resolution with China are the negative effects on CEO confidence, corporate earnings and the impact of restructuring supply chains away from China. This factor has taken a backseat (for now) to the Federal Reserve.
Federal Reserve — Since the rate hikes began in 2016, the Fed Funds rate climbed 900% from 0.25% to 2.5%. Thus, it should not be a surprise the economy is slowing. The following is a chart of Fed Funds rate:
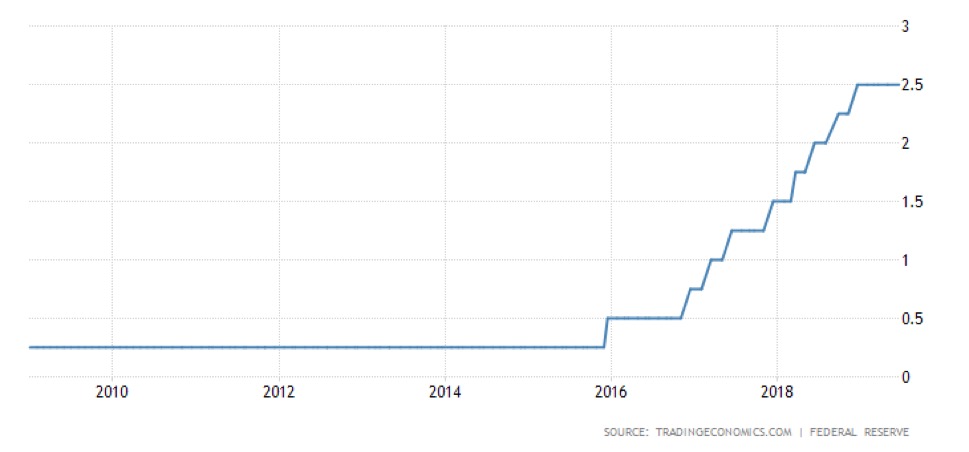
The economic cycle was extended (in the face of rising rates) due to the corporate tax cuts. This year the Fed signaled the interest rate hikes will not only be coming to an end (for now) but will be lowered by 25-50 basis points in the next two meetings. The market is currently pricing in a rate cut this month with another likely in September.
The dovish talk provided confidence in risk assets as the Fed is clearly looking to extend the cycle. We should be clear - any stimulation in animal-spirits in the short run by a rate cut has rarely (if ever) worked at extending the economic cycle. In fact, as proven during the last 40 years, the Fed is generally too late to cut rates and failed each time to avert a recession. So, we are truly in uncharted waters.
Nevertheless, the expectation for lower interest rates raises the valuations paid for earnings and has helped propel markets to all-time highs. This leaves earnings season as the current threat to the stock market. We believe AAPL and MSFT earnings releases could be the catalyst for a broad market decline. Both of these stocks are widely held by hedge funds, ETFs, mutual funds and the investing public and a sell-off could trigger broader selling.
We are not entirely pessimistic for one important reason, a material driver of weakening US corporate earnings is due to the strengthening of the US dollar against nearly every major currency in the world over the last 18 months. A Fed rate cut could help reverse this trend and support higher corporate earnings in turn.
Economic Data — It is clear the economic data is slowing in the US and in many areas around the world. The good news: investors do not “buy” the economy. The whole world knows there is an economic deceleration occurring, but the real question is:
Was the recent economic slowdown due to US-China trade and higher interest rates and will the cycle be extended when both are resolved?
The US consumer (which drives 70% of the economy) is still spending, employed and experiencing higher wages. The auto market continues to be solid despite the calls for a peak and the housing market is showing signs of life.
However, confidence from CEOs has plummeted. We do not believe the recent trade truce between US and China will serve as enough of a catalyst for CEOs to assume large capital expenditures and watch corporate spending and employment closely as signs the end of cycle is near.
In summary, the economic data point we are watching closely is employment. Once CEO’s begin to make layoffs, then we will get more concerned, but consumer is still spending at this stage of 2019.
Balance Sheet Concerns — The biggest bubble brewing is corporate debt. While our portfolio has benefited from this bubble of sorts, we are now looking to unwind some of the higher-risk fixed income in the portfolio. The flow of funds into fixed income funds has been large and the unsophisticated investing public seems to think this is “easy” money. Or, said another way, the zero interest rate policies pursued by Central Banks globally for the last decade produced an extraordinary “reach for yield” that resulted in investors continuously seeking higher and higher amounts of credit risk to generate portfolio income.
The US 10-year Treasury bond yields 2%. This may seem low but compared to other countries in the world trading at negative rates, it is still a place investors are flocking. For comparison, Greece’s 10-year Treasury bond now trades at the same yield as the US 10-year! An investor in German government bonds is knowingly invested in an asset with a negative return.
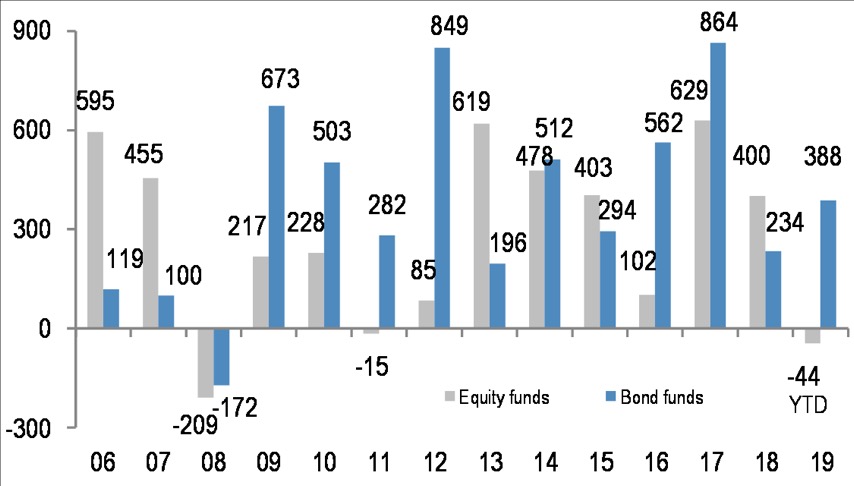
Sentiment — The longest running bull market and economic expansion continues to be the most underappreciated. The two last cycles ended with a flow of funds into stocks and a sense of euphoria. This time we continue to be surprised at the negative sentiment. It seems many investors continue to sell stocks with fear of a 2008-like event occurring. These chicken-little calls have caused many investors to miss this generational wealth-creation opportunity.
The chart below from JP Morgan displays the annual flow of assets into ETFs and actively managed mutual fund broken down by equity and fixed income. Please note strong flow of funds into bonds, but assets leaving stocks despite the strong growth.
Valuations — The questions we hear the most are “Why did so many professional investors miss this rally in stocks?” and “What did you see that others did not?” There are several factors, but perhaps the most basic place to start is the decision to own stocks versus fixed income. Consider the following chart displaying attractiveness of stocks versus fixed income at the peak of market cycles.
| Current | Peaks | |
|---|---|---|
| Fed Funds Rate | 2.4 % | 5.7 % |
| US 10 Yr Yield | 2.0 % | 6.2 % |
| US Inflation | 1.8 % | 4.1 % |
At previous cycle peaks, it made sense to own fixed income versus stocks. Investors are almost forced into stocks to get a return and keep pace with inflation. Further, the borrowing costs for corporations and consumers increased to higher levels which slowed activity. While this has occurred this cycle, the effects have been staggeringly lower and borrowing cost still low.
Outlook — The Trump administration agenda is wildly aggressive and unique. What started as a pro-business corporate tax cut evolved into an unorthodox shattering of all rules in trade diplomacy — shaking several beehives at once (Mexico, Canada, Europe, China, Iran, North Korea). The style of the Executive branch is the new normal and CEOs are working to navigate the new rules of global trade.
The trade battles can be resolved (and the economic cycle extended) if a positive outcome is achieved, but while in limbo we look to the Fed. The interest rate cuts do provide confidence and can help extend the rally, but do NOT alone stop recessions. There must be an improvement in productivity and increased corporate earnings.
As long as President Trump is in office, there is a risk of erratic behavior toward our trading partners. Thus, the 2020 election becomes a very important factor for the market. While our stance on presidential elections is NOT to invest based on political outcomes, this election could result in a massive change in political philosophies that cannot be ignored.
In conclusion, while the world is overcome by distractions and noise, we remain focused on our mantra: “Patience and Balance”. We are conservatively positioned to absorb an eventual sell-off whenever and however it comes. And, we are ready to take advantage of the terrific opportunities it will provide to produce future wealth with even less risk.
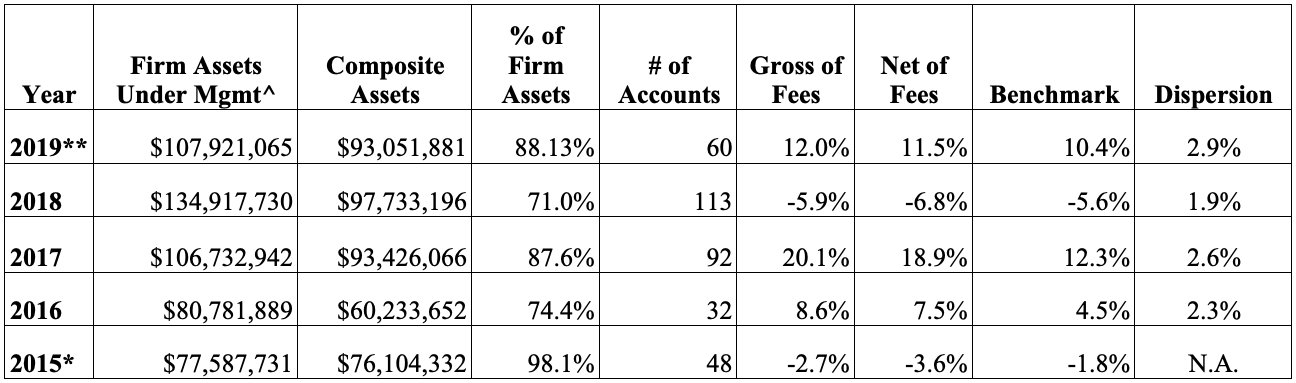
* Composite and benchmark performance are for the period 02/02/2015 through 12/31/2015.
** Composite and benchmark performance are for the period 01/01/2019 through 06/30/2019.
*** Dispersion was calculated using partial year data. Dispersion is the size of the range of values expected or received around a particular value such as an average.
^ Total does not include assets under sub advisory.
Lear Investment Management (“LIM”) claims compliance with the Global Investment Performance Standards (GIPS®) and has prepared and presented this report in compliance with the GIPS standards. LIM has been independently verified for the periods 02/02/2015 through 12/31/2017. The verification report is available upon request.
Verification assesses whether (1) the firm has complied with all the composite construction requirements of the GIPS standards on a firm-wide basis and (2) the firm’s policies and procedures are designed to calculate and present performance in compliance with the GIPS standards. Verification does not ensure the accuracy of any specific composite presentation
Firm Information: LIM is a Registered Investment Advisor based in Dallas, Texas and registered with the Securities and Exchange Commission. Registration does not imply a certain level of skills or training. LIM is a company with purpose, dedicated to creative and unique thinking. We focus on portfolio valuation and research, along with a superior client experience. We seek to identify investment opportunities by looking at economic factors, security valuation and human behavior. We start with the fundamentals of portfolio management and valuation. Then we build on these fundamentals with unique thinking and creative intelligence-gathering to form a viable investment thesis. We believe this approach leads to dynamic global portfolios with increased return and managed risk. LIM utilizes Charles Schwab & Co. Inc. (“Schwab”), a FINRA-registered broker-dealer, member SIPC, as its custodian of assets. LIM is independently owned and operated and not affiliated with Schwab.
Composite Characteristics: The LIM Global Vigilance Composite is a collection of separate accounts managed by LIM. Currently the composite holds approximately 60% equities, 35% fixed income and 5% money market. The composite is tracked by Black Diamond (an Advent company). The composite is $92 million dollars of total assets and made up of 72 accounts. These are actual clients of the firm and are all managed by the Lear Investment Management portfolio management team. The strategy is global (US and abroad) equities, fixed income, and cash - depending on market conditions. The composite reinvests dividends. Individual account performance will differ. Past performance is not indicative of future results. The composite was created on February 1, 2015. The composite minimum account size is $100,000. The composite includes accounts over $100,000, one to three months after inception (depending on how the assets were received). The firm’s list of composite descriptions is available upon request.
Calculation Methodology: Composite returns are calculated by asset-weighting the individual portfolio returns using beginning-of-period values. Composite returns are calculated on a daily basis and geometrically linked to calculate the monthly return. Cash flow timing method: contributions are recorded at the beginning of the day (AM) and distributions are recorded at the end of the day (PM). LIM may use leverage up to 150% of the portfolio net assets as part of investment strategy. Derivatives are not used. Depending on the conditions in the financial markets, the firm may utilize options to hedge entire portfolios or a specific security within a portfolio. LIM calculates the asset-weighted standard deviation of the annual gross returns for composites that have six or more portfolios in the composite for the entire year using Black Diamond. LIM’s policies for valuing portfolios, calculating performance and preparing compliant presentations are available upon request. The three-year annualized standard deviation measures the variability of the composite and the benchmark returns over the preceding 36-month period. The three-year annualized standard deviation is not presented for 2015 through 2017 due to less than 36 months of composite and benchmark data.
Benchmark: The customized Composite Benchmark is currently 50% Bloomberg Barclays Aggregate Bond Index & 50% FTSE Global Equity All-World (gross of foreign withholding taxes on dividends), calculated daily.
Net-of-fee Performance: Net-of-fee performance shown is calculated by Black Diamond (an Advent Company) and reflects the deduction of actual management fees charged by LIM and any applicable trade fees charged by Schwab. Valuations and performance are computed in US dollars, and individual portfolios are revalued daily.
Fee Schedule: For Private Client: 1.00% on the first $10 million of assets under management. 0.90% on assets from $10 million to $30 million and 0.80% on assets of $30,000,001 or more. Institutional Clients’ fee schedule may vary.
This material represents an assessment of the market and economic environment at a specific point in time and is not intended to be a forecast of future events, or a guarantee of future results. Forward-looking statements are subject to certain risks and uncertainties. Actual results, performance, or achievements may differ materially from those expressed or implied. Information is based on data gathered from what we believe are reliable sources. It is not guaranteed as to accuracy, does not purport to be complete and is not intended to be used as a primary basis for investment decisions. It should also not be construed as advice meeting the particular investment needs of any investor. Past performance does not guarantee future results.
Neither Asset Allocation nor Diversification guarantee a profit or protect against a loss in a declining market. They are methods used to help manage investment risk.